1.1.1 State that error bars are a graphical representation of the variability of data
- Error bars show the spread of measurements around a central tendency (e.g. mean) on a graph
- Error bars will usually show either:
- The range of data (all the samples)
- The standard deviation (68% of the sample)
- The 95% confidence intervals (CI)
1.1.2 Calculate the mean and standard deviation of a set of values
Data can be measured in one of three ways:
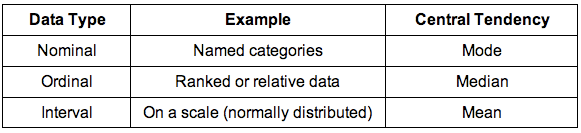
Mean:
- The average of a group of data entries
- Calculation method = sum of data entries / total number of data entries
Standard Deviation:
- Measures the variability (spread) in a set of data that is normally distributed (Gaussian)
- In order to ensure normal distribution of the standard deviation, certain outliers may need to be excluded from the data set (with justification)
1.1.3 State that the term standard deviation is used to summarise the spread of values around the mean, and that 68% of the values fall within one standard deviation of the mean
- Data which is normally distributed will exhibit a bell-shaped (Gaussian) curve which is symmetrical around a central mean
- 68% of data values will fall within one standard deviation of the mean
- 95% of data values will fall within two standard deviations of the mean
- 99.8% of data values will fall within three standard deviations of the mean
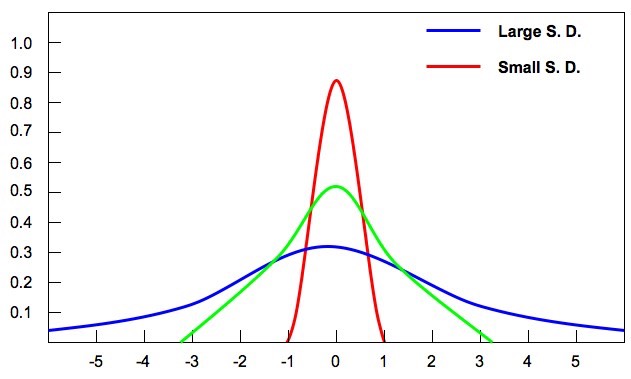
1.1.4 Explain how the standard deviation is useful for comparing the means and spread of data between two or more samples
- Data sets that have the same mean may not have the same degree of variation in data
- As standard deviation measures the spread of data, it can be used to compare data sets
- The diagram below shows three sets of data with identical means but different spreads of data
- A higher standard deviation means there is greater variation in the data set, whereas a lower standard deviation means there is less
Graphical Representations of Data Spread
1.1.5 Deduce the significance of the difference between two sets of data using calculated values for t and the appropriate tables
- A t-test is a statistical test used to compare two means (e.g. between a control group and an experimental group)
- It can be used to compare a null hypothesis against an alternative hypothesis:
- Null hypothesis: There is no significant difference between the means
- Alternative hypothesis: There is a significant difference between two means
- A t-test can be either one-tailed (difference only) or two-tailed (difference and direction)
Conducting a t-test:
- A t-test is a statistical formula that calculates a t value based on a set of data
- If there is a significant difference between the two means, then the t value will be greater than a determined value for a given degree of probability
- Scientists generally consider data to be statistically significant when there is less than a 5% probability the results are due to chance
- This 95% confidence level is a probability value of p<0.05
- The reliability of a given t value will be affected by the size of the population used in the study (a small population is less reliable)
- The population size is reflected by the degrees of freedom, which is calculated as population size minus two (df = n - 2)
![]() Conducting t-tests using Excel
Conducting t-tests using Excel
Calculating significance:
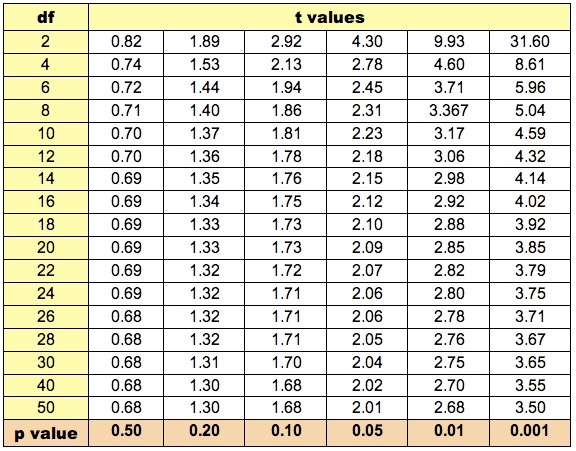
- Once a t-test has been conducted and a t value generated, statistical significance is determined by completing the following steps:
- Step 1: Determine degree of freedom (df = n - 2)
- Step 2: Determine p value (p<0.05)
- Step 3: Compare t value against value given for the conditions outlined in steps one and two
- If the t value is greater than the value provided in the table, the data can be considered statistically significant (reject the null hypothesis)
Table of t Values
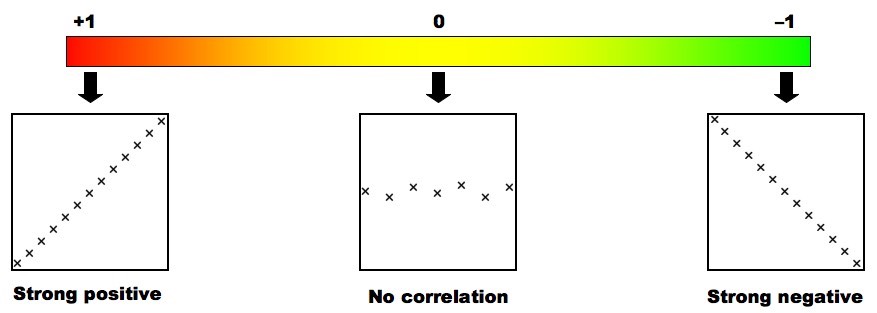
1.1.6 Explain that the existence of a correlation does not establish that there is a causal relationship between two variables
Correlation describes the strength and direction of a linear relationship between two variables
- Is positive (x = y) or negative (x = - y)
Causation describes the relationship between two variables, where one variable has a direct effect on another
Correlation does not automatically indicate causation – just because two variables change in relation to one another, does not mean they are linked
- E.g. CO2 levels and crime have both risen, but CO2 levels don't cause crime
Types of Correlation