D.5.1 Outline the value of classifying organisms
Classification systems for living organisms are of value because they:
- Allow us to distinguish between and compare organisms based on characteristics
- Makes it easier to identify organisms according to a globally recognised scheme
- Makes it easier to collect, sort and store information about organisms
- Shows how closely organisms are related and suggests evolutionary links
- Allows predictions to be made (about characteristics of members of a group)
D.5.2 Explain the biochemical evidence provided by the universality of DNA and protein structures for the common ancestry of living organisms
- All organisms use DNA and RNA as their genetic material
- Four bases (adenine, guanine, thymine, cytosine) form the basis of this code and undergo the same complementary pairing (A = T ; G = C)
- Conserved genes have similar functions
- Common mechanisms for DNA replication and protein synthesis are used by all organisms (including similar enzymes for these processes)
- The genetic code is (almost) universal – the same codons code for the same amino acids
- All living organisms use the same 20 amino acids for protein synthesis
- These amino acids are all L-isomers and not D-isomers
- Large groups of organisms share certain proteins and metabolic pathways (e.g. haemoglobin, cytochrome c)
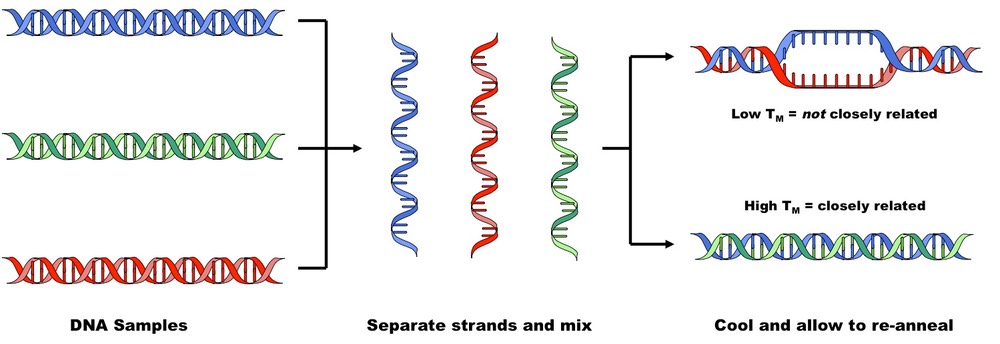
- The degree of difference between organisms in DNA / protein sequence demonstrates the level of relationship between organisms
- The more similar the base / amino acid sequences are, the more closely related two species are likely to be
Comparing DNA Sequences using DNA-DNA Hybridisation
D.5.3 Explain how variation in specific molecules can indicate phylogeny
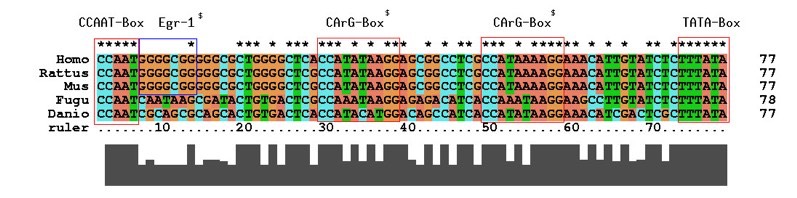
- Phylogeny refers to an evolutionary line of descent and can be determined by comparing similar molecules in different species (e.g. haemoglobin)
- Variations in these molecules (either base or amino acid sequence) will occur due to mutations
- The greater the differences between the common molecules, the longer the time span since the two species had a common ancestor
- Mitochondrial DNA is useful for tracing phylogeny as it is inherited via the maternal line, lacks recombination and has a known mutation rate
A Comparison of DNA Sequences from Different Species (Multiple Alignment)
D.5.4 Discuss how biochemical variation can be used as an evolutionary clock
- Some genes or protein sequences may accumulate mutations at a relatively constant rate (e.g. a 1% change per million years)
- If this rate of change is reliable, scientists can calculate the time of divergence based on the number of differences between two species
- This concept is called the evolutionary clock (or 'molecular clock'), and is limited by a number of factors:
- The rate of change can differ for different groups of organisms (e.g. animals and plants)
- The rate of change can vary between different genes and different proteins
- Over long periods, earlier changes may be reversed by later changes
D.5.5 Define clade and cladistics
Clade: A group of organisms consisting of a single common ancestor and all descendants of that ancestor
Cladistics: A method of classification of living organisms based on the construction and analysis of cladograms
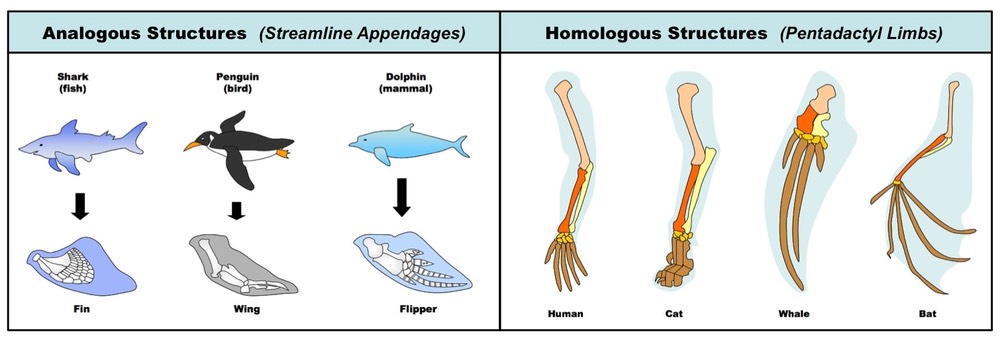
D.5.6 Distinguish, with examples, between analogous and homologous characteristics
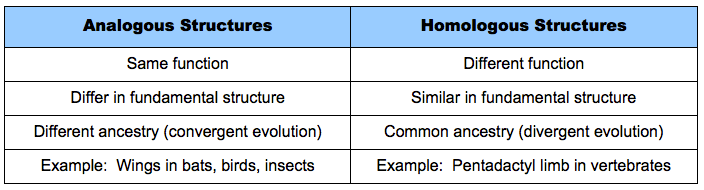
Analogous versus Homologous Structures
D.5.7 Outline the methods used to construct cladograms and the conclusions that can be drawn from them
Constructing Cladograms
- A cladogram is a tree-like diagram where nodes represent the splitting of two new groups from a common ancestor
- Members of a clade typically share a set of features not found in more distant relatives
- Cladistics are most commonly based on molecular differences (base or amino acid sequences)
- Cladograms are calculated by software that depicts the cladogram with the fewest number of brances
- For rooting the cladogram, an outgroup (most distantly related species) is used
Conclusions from Cladograms
- The more nodes between two groups the less closely related they are expected to be
- Cladograms are based on probability, but improbable events (e.g. certain mutations) can occur, so relationships may be wrong
D.5.8 Construct a simple cladogram
Step 1: Organise organisms according to defined characteristics
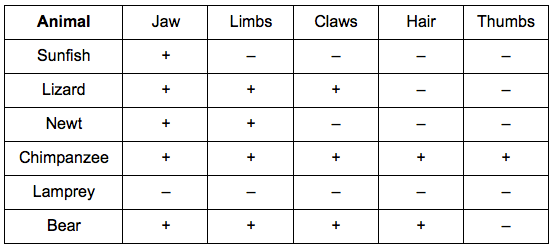
Step 2: Represent this information as a cladogram by ordering organisms by shared characteristics (nodes)
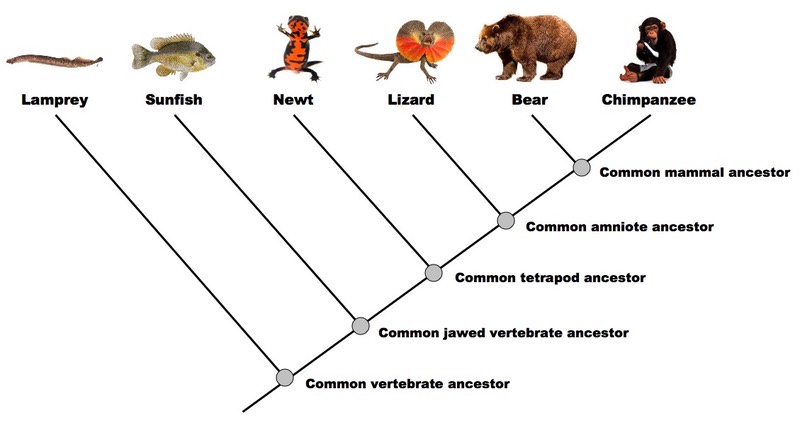
D.5.9 Analyse cladograms in terms of phylogenetic relationships
The more nodes between two groups, the less closely related they are expected to be
According to the cladogram above:
- The chimpanzee is most similar to the bear
- The lizard is equally similar to the bear and chimpanzee
D.5.10 Discuss the relationship between cladograms and the classification of living organisms
- Classification was traditionally based on morphology (structural characteristics)
- Methods used to construct cladograms typically utilise a different approach (e.g. molecular data - more objective)
- Cladograms can show ancestral relationships and reflect how recently two groups shared a common ancestry
- As such they should be considered a good complement to traditional classification schemes
- In some cases, cladograms have lead to revisions in scientific classifications