


Statistical Tests
Inferential Statistics
Inferential statistics are calculations performed to determine if experimental trends are statistically significant or are due to chance
-
Statistical significance is represented by a p value (probability of chance), with a result considered significant if there is less than a 5% probability that it is due to chance (p<0.05)
A statistical test will involve two distinct hypotheses – one will be supported by the test and one will be rejected
-
Null hypothesis (H0): There is no difference between the independent and dependent variables (results are due to chance)
-
Alternative hypothesis (HA): There is a statistically signficant difference between the independent variable and dependent variable
Different types of statistical tests are utilised according to the type of data being analysed:
-
Chi-squared test: Used when the data is in frequencies or counts to determine a ‘goodness of fit'
-
T-test: Compares the means of two sets of data to determine if a difference is significant (sample size > 10)
-
ANOVA: Compares the means of three or more groups to determine if a difference is significant (sample size > 30)
-
Following an ANOVA test, a post-hoc Tukey HSD test is required to determine which of the groups are significantly different
-
Each statistical test produces a value that must exceed a critical value to be considered statistically significant
-
The critical value typically represents a p value of 0.05 – if this is exceeded the null hypothesis is rejected
Distribution Tables
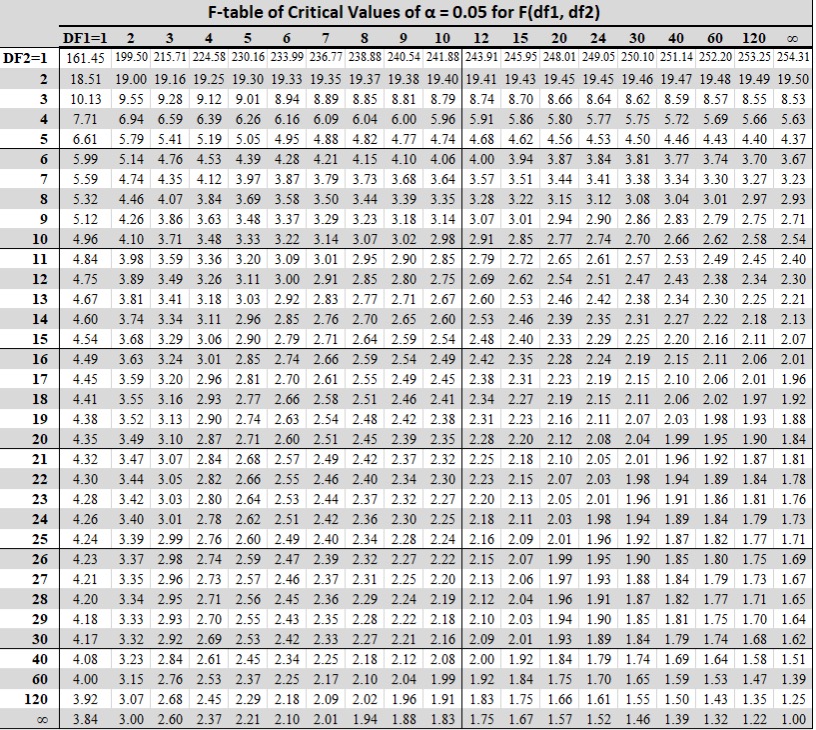
F-Table (ANOVA)
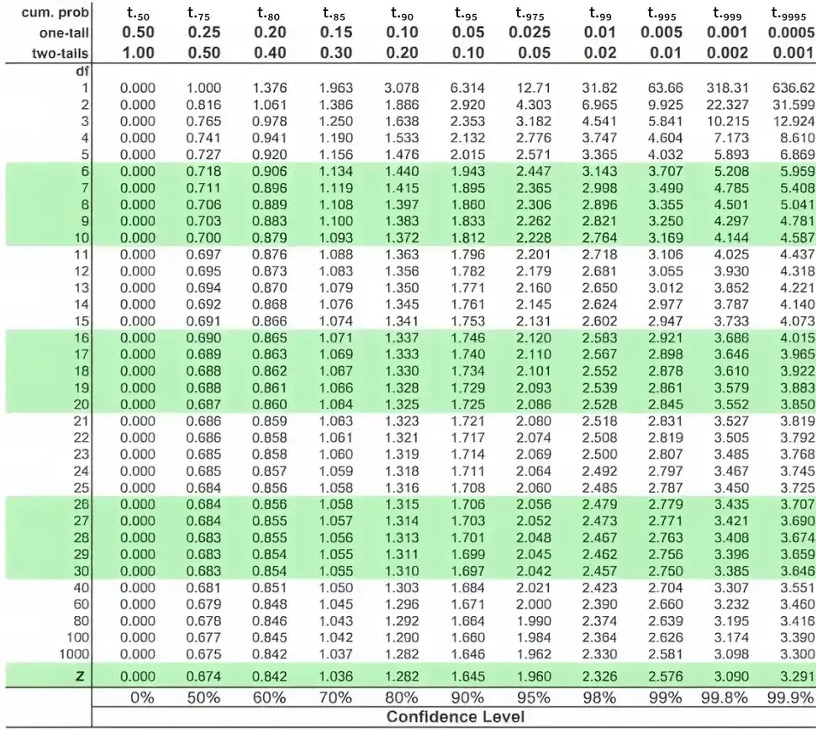
T-Table (T-Test)
