
Test Crosses
Statistical testing of phenotypic data can be used to determine if two characteristics are linked or unlinked
-
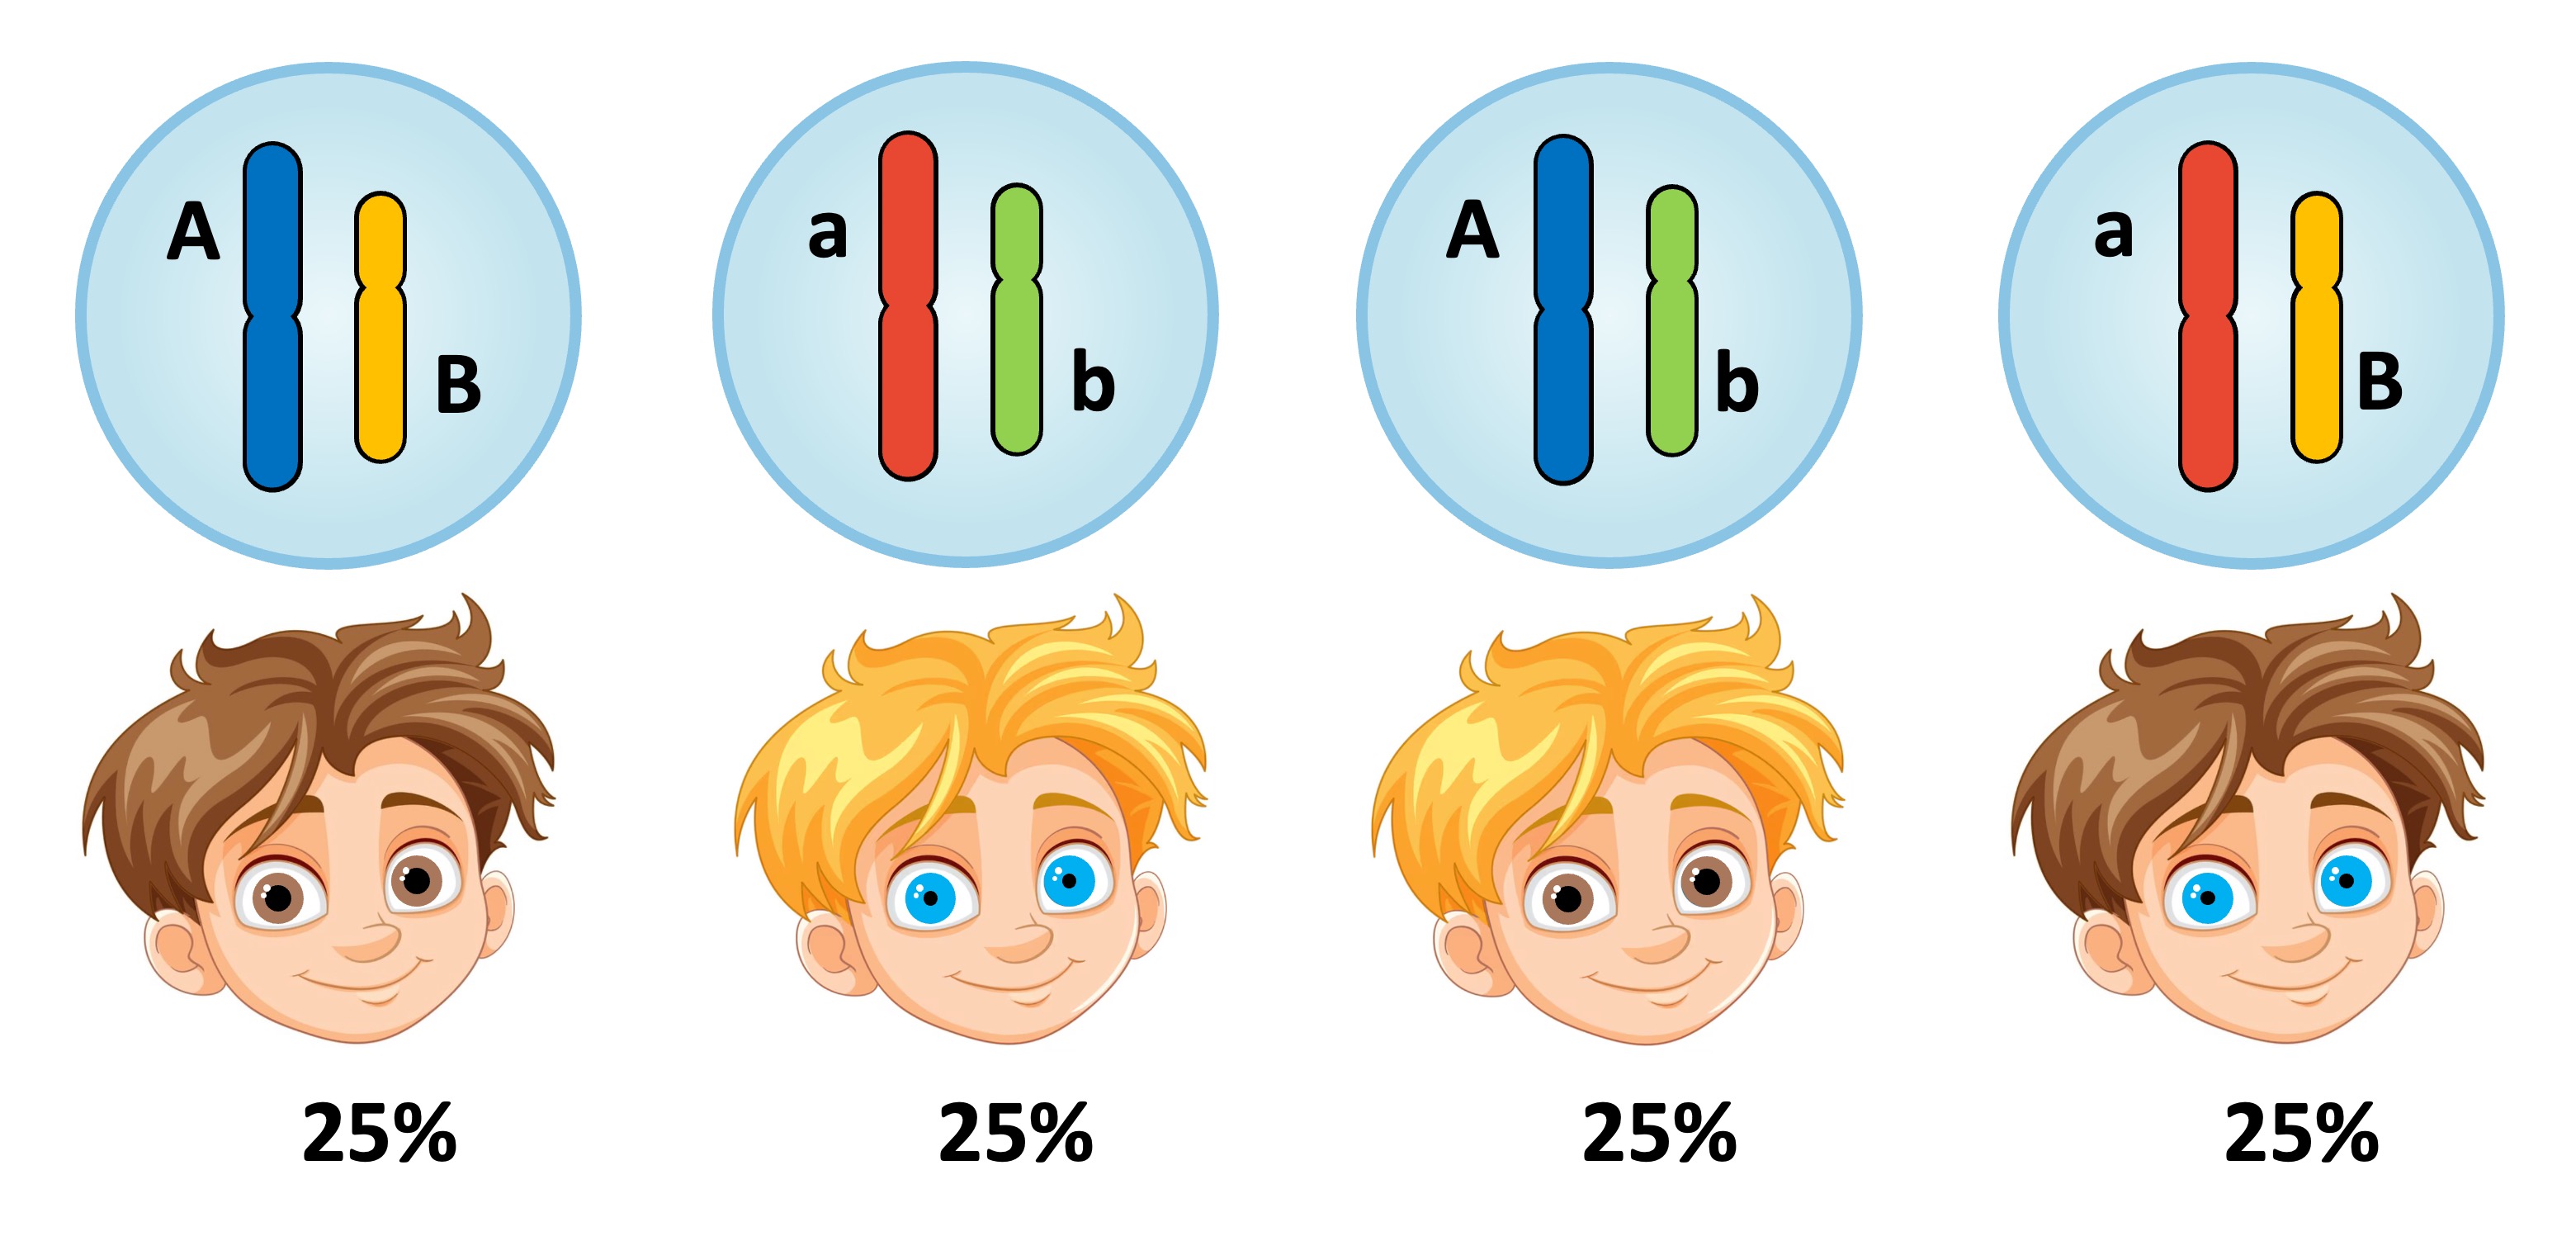
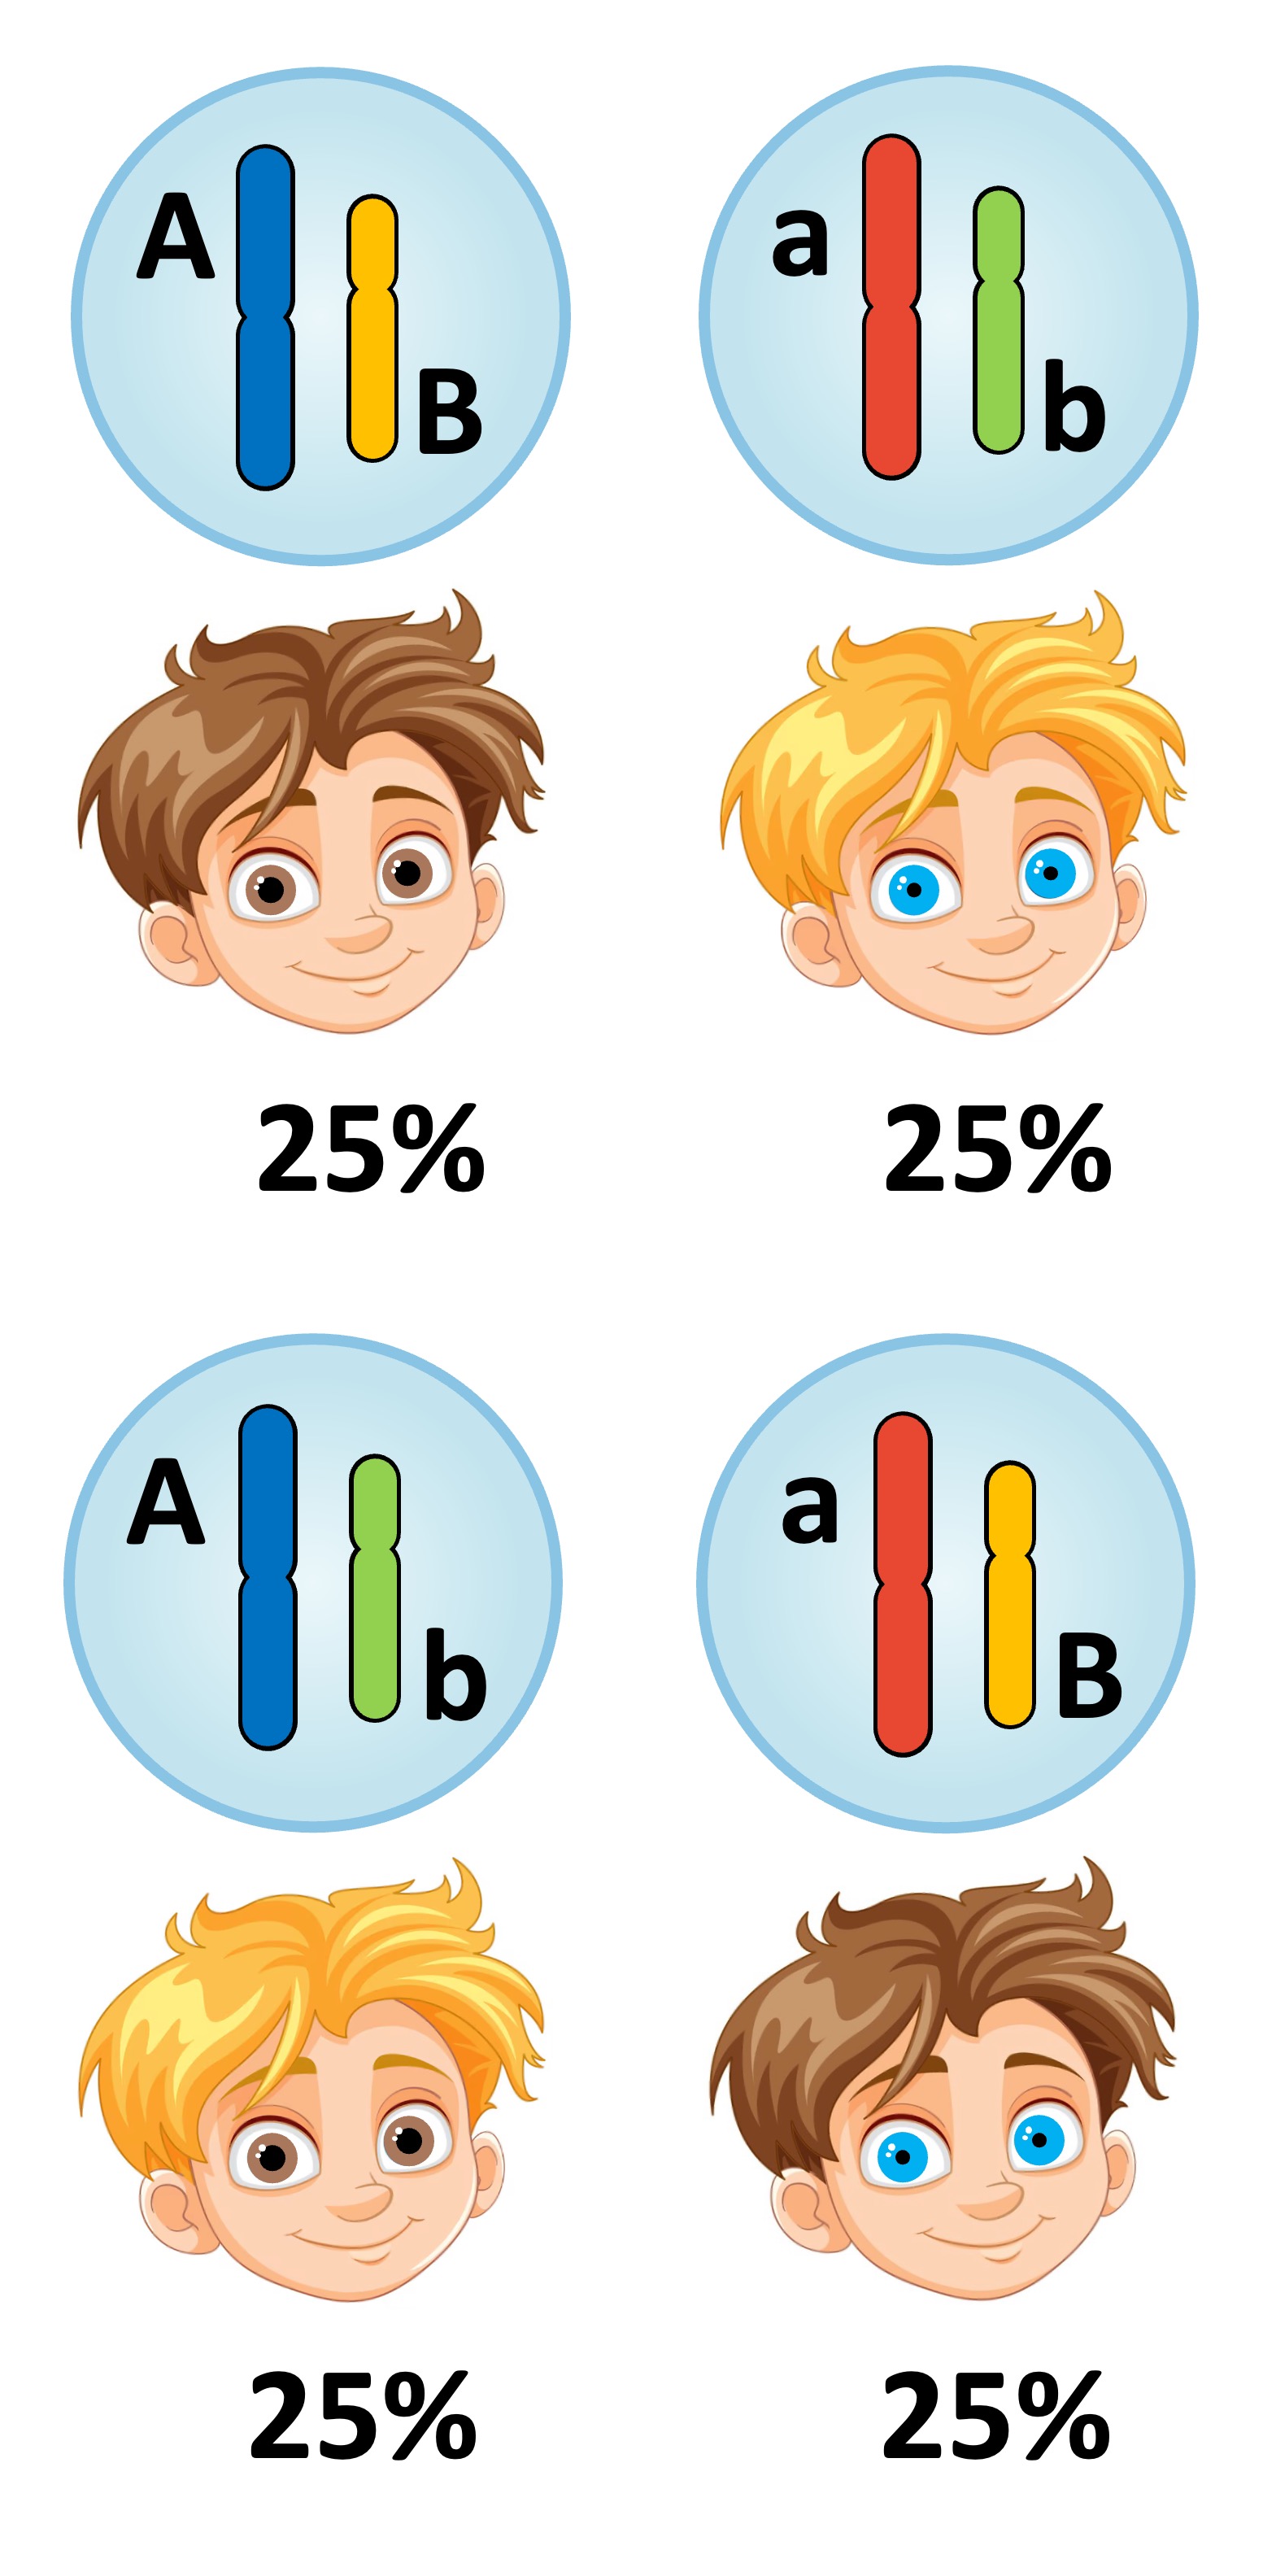
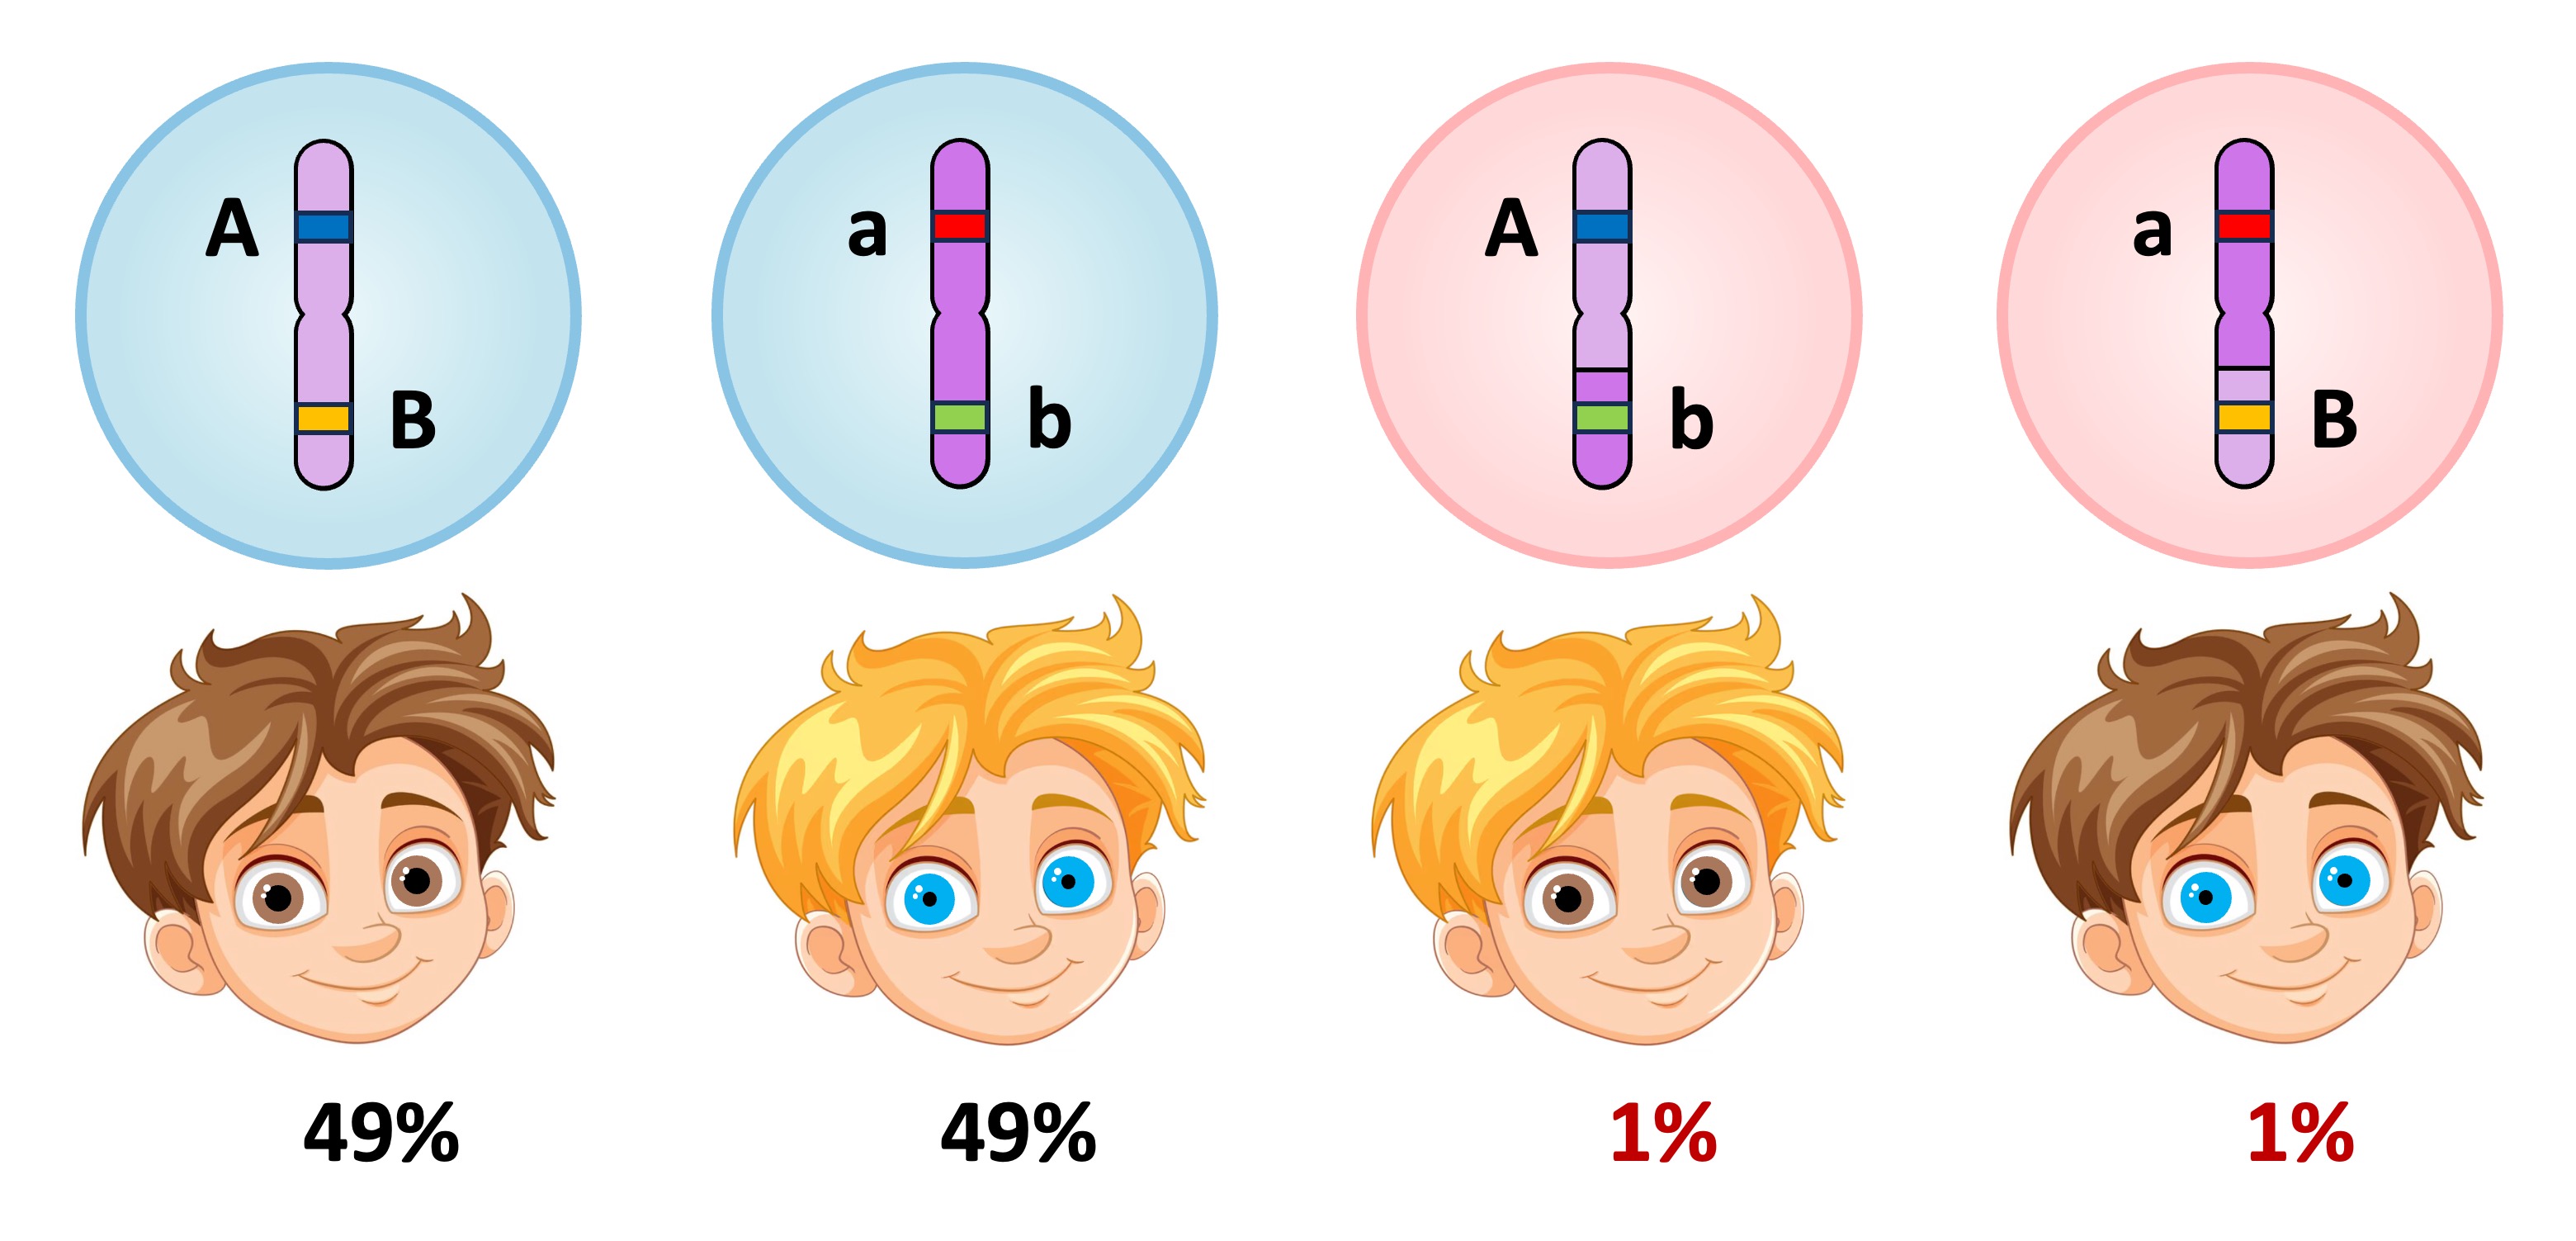
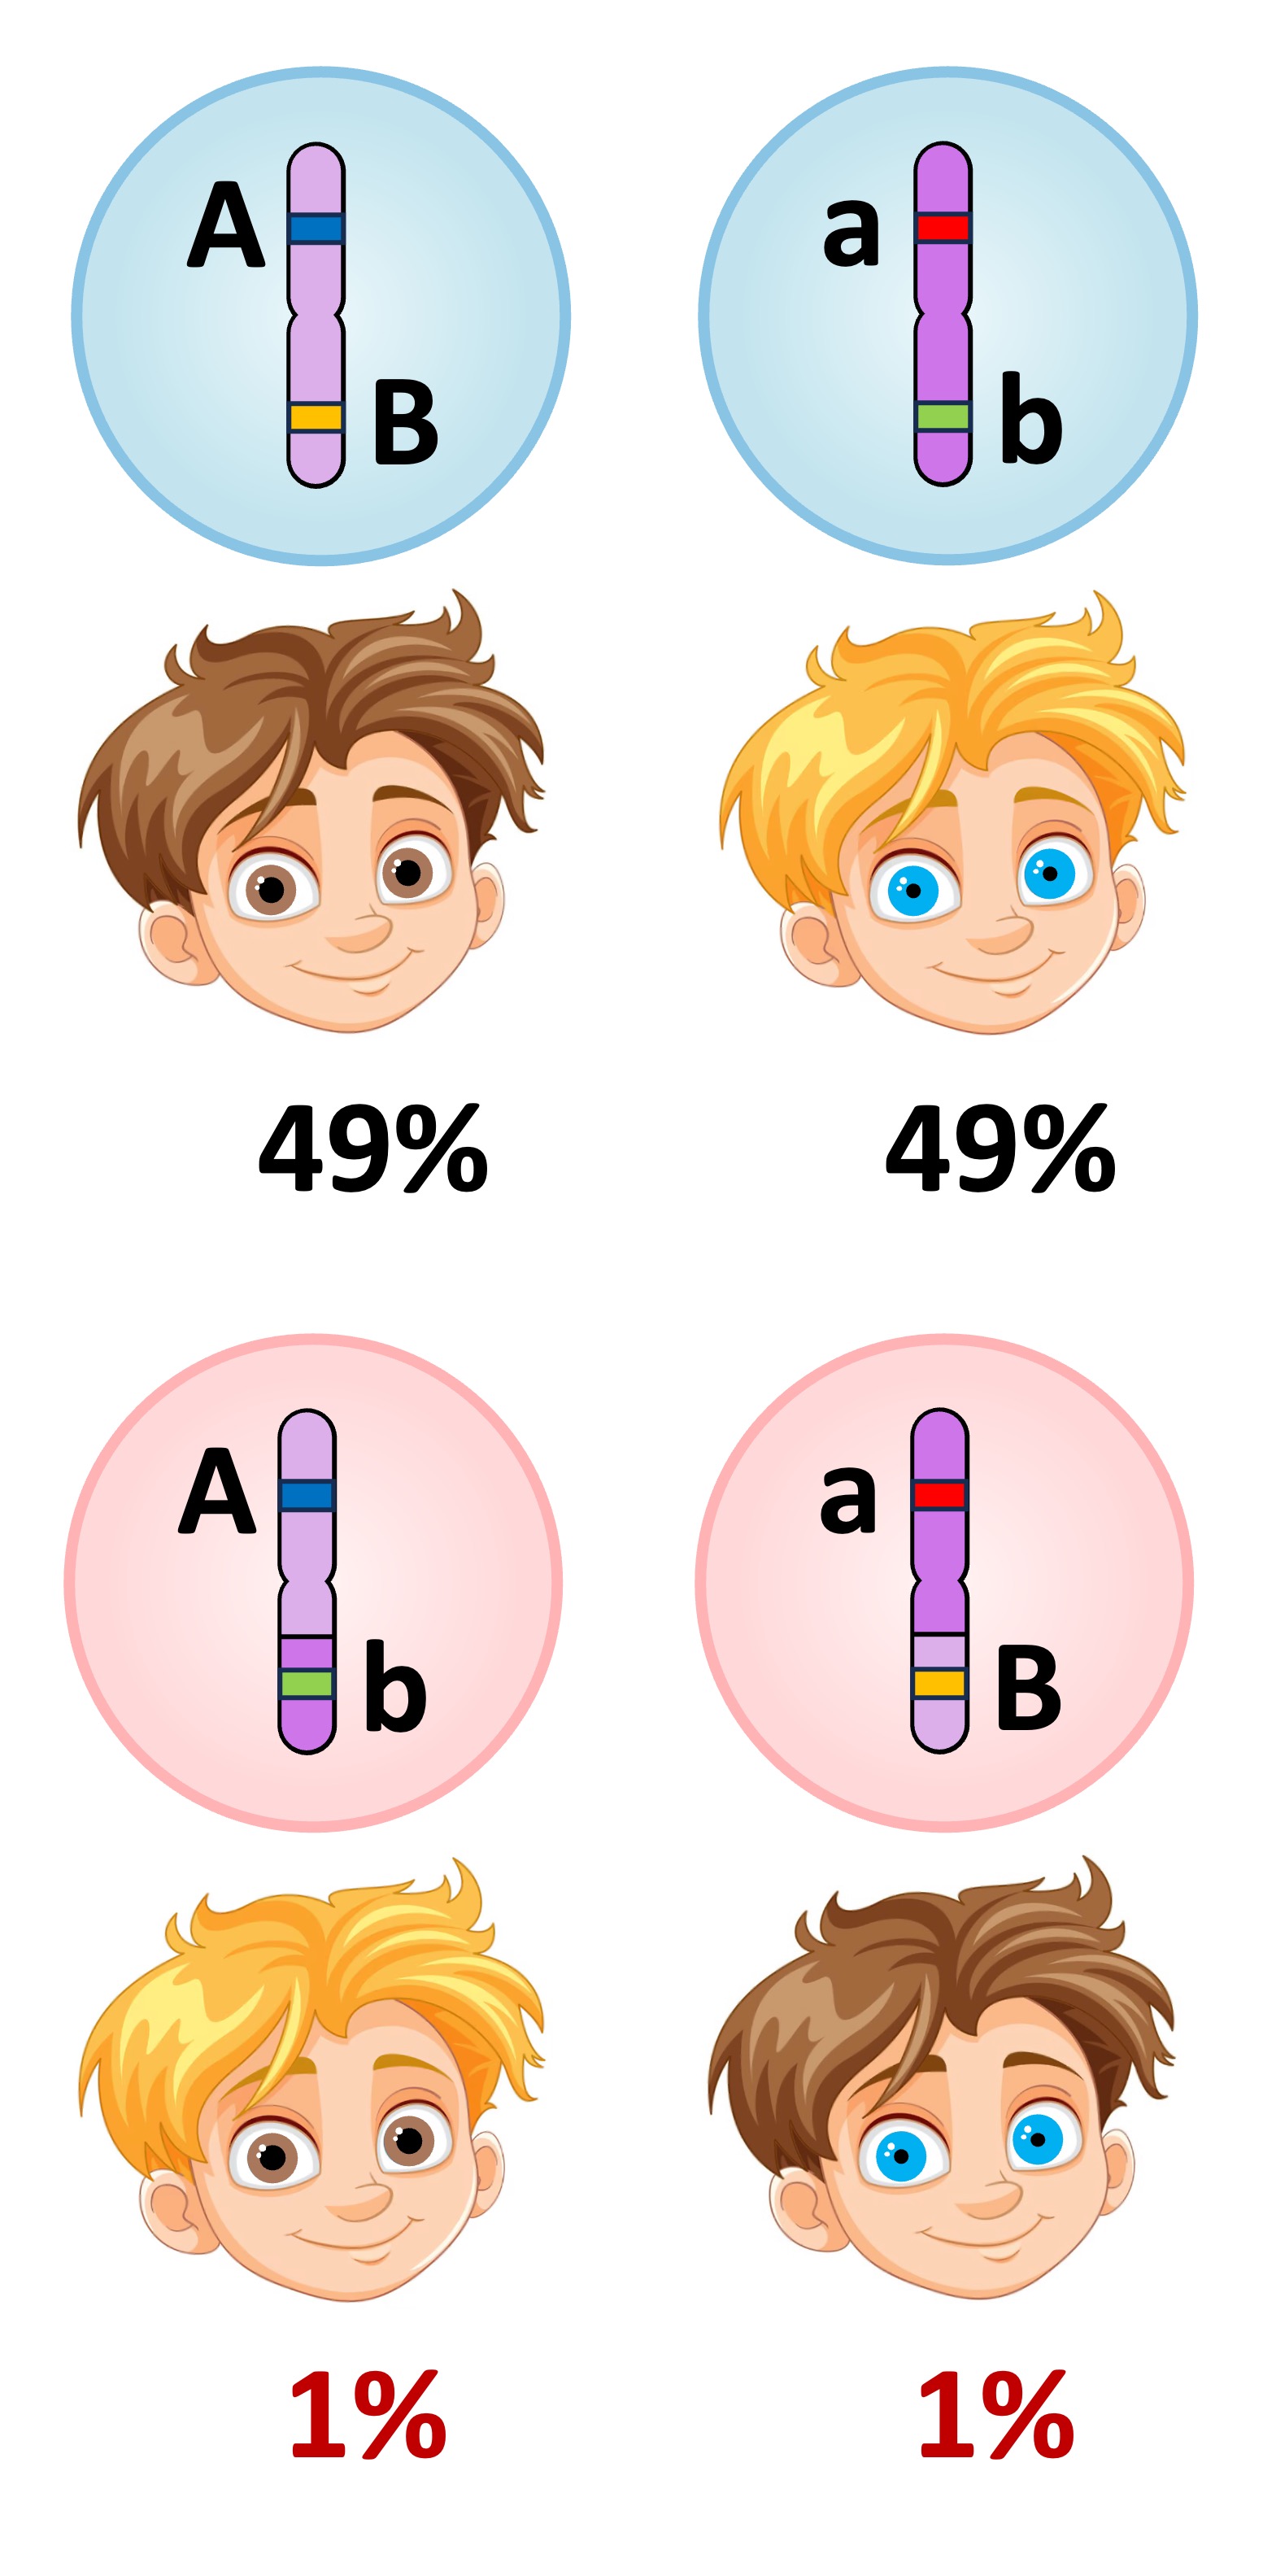
Linked genes produce different phenotypic ratios than unlinked genes because recombinants can only arise via crossing over (a random and uncommon event)
-
By comparing observed data against the expected patterns for unlinked genes, a chi-squared test can determine the likelihood of two genes being linked
Unlinked versus Linked


Unlinked Genes


Linked Genes
Performing a Chi-Squared Test
The trait for smooth peas (R) is dominant over wrinkled peas (r) and yellow pea colour (Y) is dominant to green (y)
-
Two heterozygous pea plants are crossed (RrYy × RrYy) and yield the following results:
-
701 smooth yellow peas
-
204 smooth green peas
-
243 wrinkled yellow peas
-
68 wrinkled green peas
-
Step 1: Calculate expected frequencies for an unlinked trait
-
Expected frequencies can be determined by completing a dihybrid cross (i.e. punnett grid)
-
Phenotypic ratios = 9 smooth yellow : 3 smooth green : 3 wrinkled yellow : 1 wrinkled green
RY
Ry
rY
ry
RY
RRYY
RRYy
RrYY
RrYy
Ry
RRYy
RRyy
RrYy
Rryy
rY
RrYY
RrYy
rrYY
rrYy
ry
RrYy
Rryy
rrYy
rryy
Step 2: Construct a table of frequencies
-
Observed values are the actual values collected from crossing the pea plants
-
Expected values = phenotypic ratio × total number of peas
-
Total peas = 701 + 204 + 243 + 68 = 1216
O
E
Smooth Yellow
701
684
Smooth Green
204
228
Wrinkled Yellow
243
228
Wrinkled Green
68
76
Step 3: Calculate a chi-squared value
-
χ2 = ∑(O – E)2 ÷ E
-
0.42 + 2.53 + 0.99 + 0.84 = 4.76
Smooth Yellow
Smooth Green
Wrinkled Yellow
Wrinkled Green
(O – E)2 ÷ E
0.42
2.53
0.99
0.84
(O – E)2 ÷ E
Smooth Yellow
0.42
Smooth Green
2.53
Wrinkled Yellow
0.99
Wrinkled Green
0.84
Step 4: Identify the p value
-
The p value indicates the probability that the results are due to chance (lower p value is more significant)
-
A p value of less than 5% chance (p<0.05) is considered to be statistically significant
-
-
The degree of freedom (df) designates what range of values fall within each significance level
-
For this dihybrid cross, the degree of freedom should be 3 (number of phenotypes – 1)
-
-
If p<0.05 the alternative hypothesis is accepted, otherwise the null hypothesis is accepted
-
Alternative hypothesis: There is a significant difference between observed and expected frequencies (genes are linked)
-
Null hypothesis: There is no significant difference between observed and expected frequencies (genes are unlinked)
-
p value
0.25
0.1
0.05
0.01
df = 3
4.11
6.25
7.82
11.3
Step 5: Determine statistical significance
-
The chi-squared value (4.76) is less than the critical value for significance (7.82)
-
Hence the results are not statistically significant (null hypothesis is accepted – genes are unlinked)


