
Polygenic Traits
Variation in phenotypes for a particular characteristic can be either discrete (discontinuous) or continuous
-
Monogenic traits (characteristics controlled by a single gene loci) tend to exhibit discrete variation, with individuals expressing one of a number of distinct phenotypes
-
Polygenic traits (characteristics controlled by more than two gene loci) tend to exhibit continuous variation, with an individual’s phenotype existing somewhere along a continuous spectrum of potential phenotypes
In the case of polygenic inheritance:
-
Increasing the number of loci responsible for a particular trait increases the number of possible phenotypes
-
This results in a phenotypic distribution that follows a Gaussian (bell-shaped) normal distribution curve
Phenotypic characteristics are not solely determined by genotype, but are also influenced by environmental factors
-
The added effect of environmental pressures functions to increase the variation seen for a particular polygenic trait
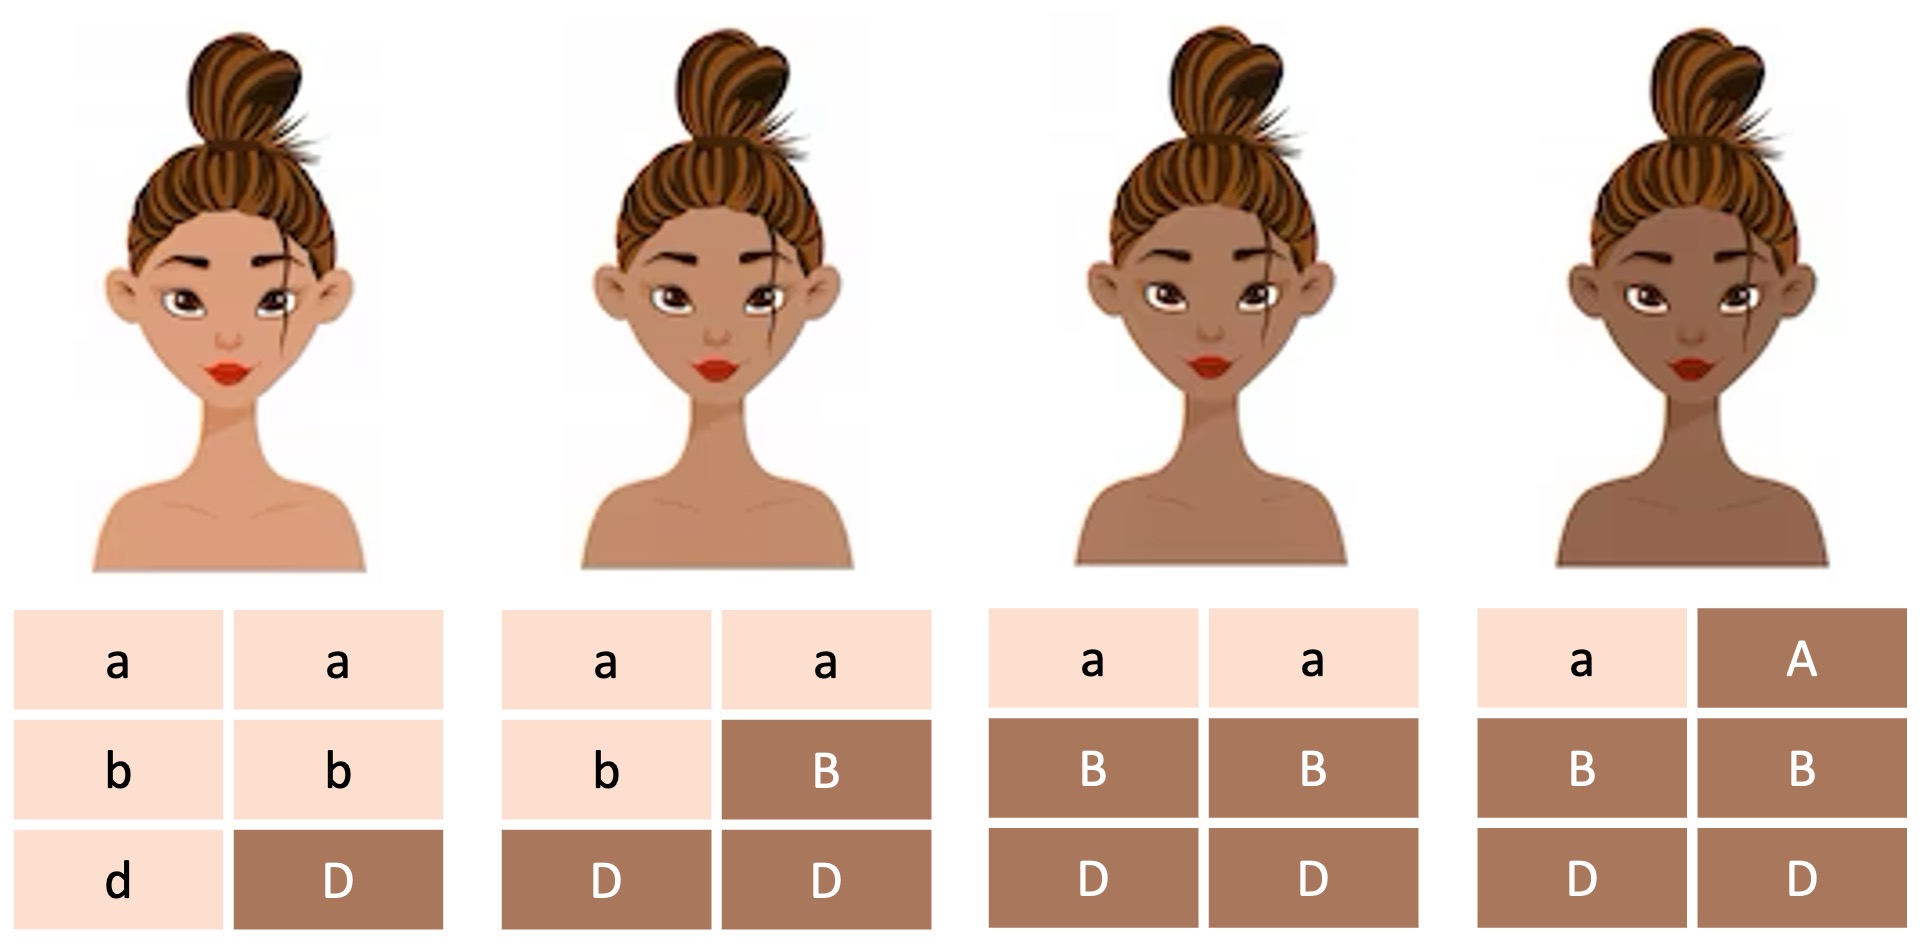
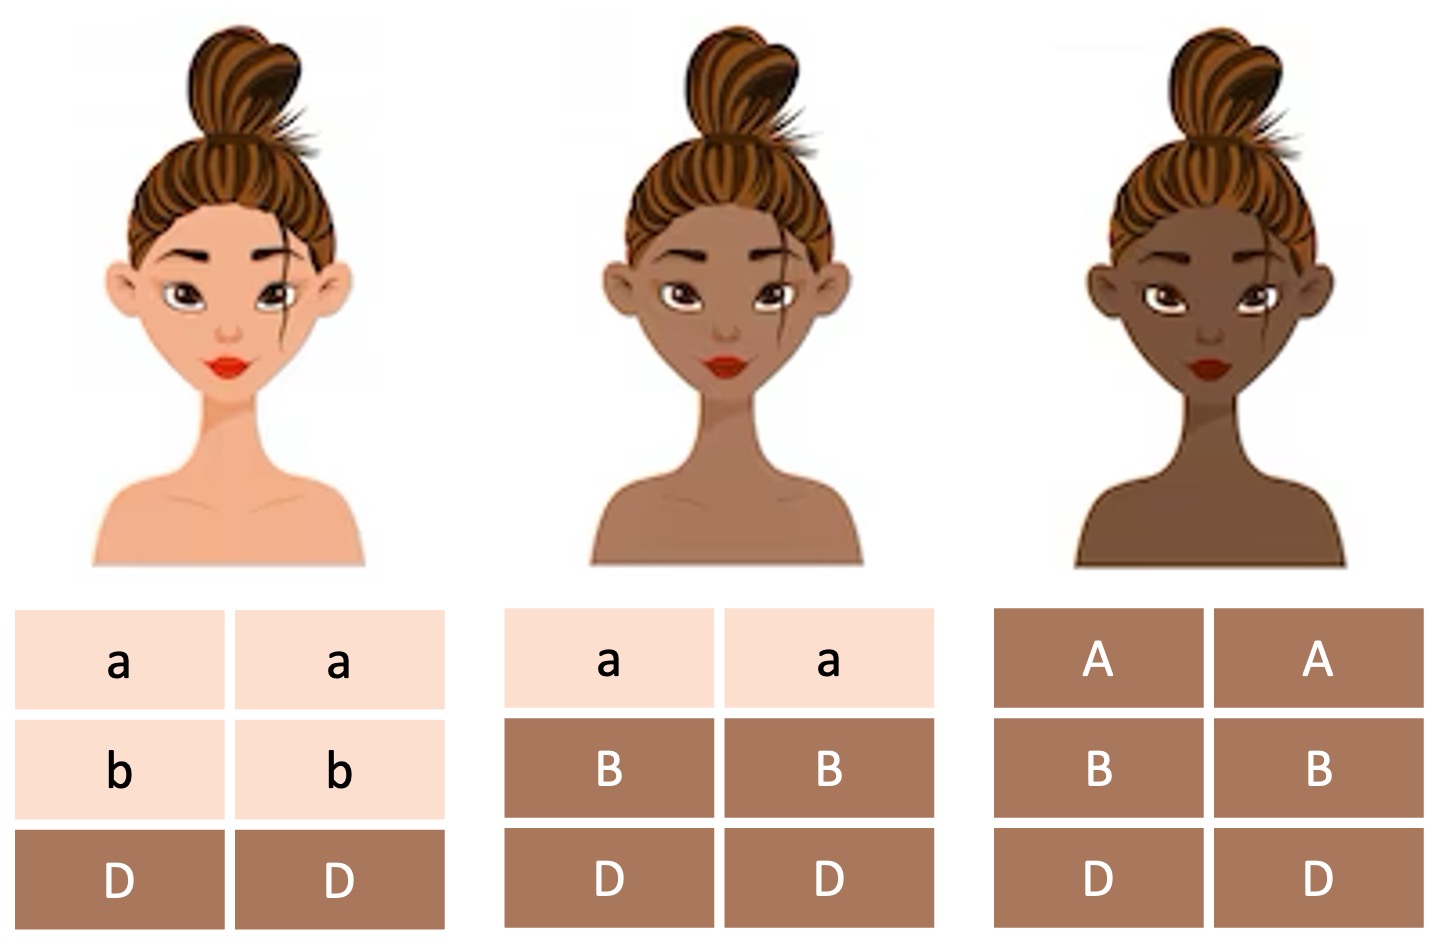
An example of a polygenic trait that is influenced by environmental factors is human skin colour
-
Skin colour is controlled by multiple melanin producing genes, but is also affected by factors such as sun exposure
Human Skin Colour


Statistical Analysis
While polygenic characteristics show continuous variation along a phenotypic spectrum, not all population subsets will necessarily follow a normally distributed bell-shaped curve
-
Environmental selection pressures can cause directional or disruptive selections that may change the distribution and frequency of phenotypes
-
Additionally, smaller populations are more susceptible to random changes in allele frequency (genetic drift), leading to the potential occurrence of outliers
A box-and-whisker plot is a statistical tool that can be used to visually represent the spread of population data
-
The plot can show minimum, maximum and median values, as well as demonstrate the range via a lower and upper quartile
-
This allows researchers to easily assess how variable the data is and whether or not it is skewed in a particular direction
The other benefit of a box-and-whisker plot is that it allows for the statistical determination of outliers
-
Outliers are any measurements that deviate by a significant margin from all other values (e.g. more than three standard deviations outside of the mean)
-
For a box-and-whisker plot, a data point is categorized as an outlier if it is either above the third quartile or below the first quartile by a value of more than 1.5 time the interquartile range (IQR)
Box-and-Whisker Plots
Based on the data included below:

-
The minimum value (lowest number) is 1 and the maximum value (higher number) is 9
-
The median value (middle number in a distribution) is 5.5
-
The lower quartile is 2 and the upper quartile is 8, giving an interquartile range of 6 (8 – 2)
-
A value is considered an outlier if it is less than –7 (2 – 1.5 × 6) or more than 17 (8 + 1.5 × 6)
From this data, the following box-and-whisker plot can be constructed:


