

Keeling Curve
Atmospheric carbon dioxide concentrations have been measured at the Mauna Loa Observatory (in Hawaii) since 1958 by Charles Keeling
-
The pattern of carbon flux that has been developed from this data is known as the Keeling Curve
The following trends are evident from the Keeling Curve:
-
CO2 levels fluctuate annually (lower in the summer months when long days and more light increase photosynthetic rates)
-
Global CO2 trends conform to northern hemisphere patterns as it contains more of the planet’s land mass (i.e. more trees)
-
CO2 levels are steadily increasing year on year since the industrial revolution (due to increased burning of fossil fuels)
-
Atmospheric CO2 levels are currently at the highest levels recorded since measurements began
Keeling Curve
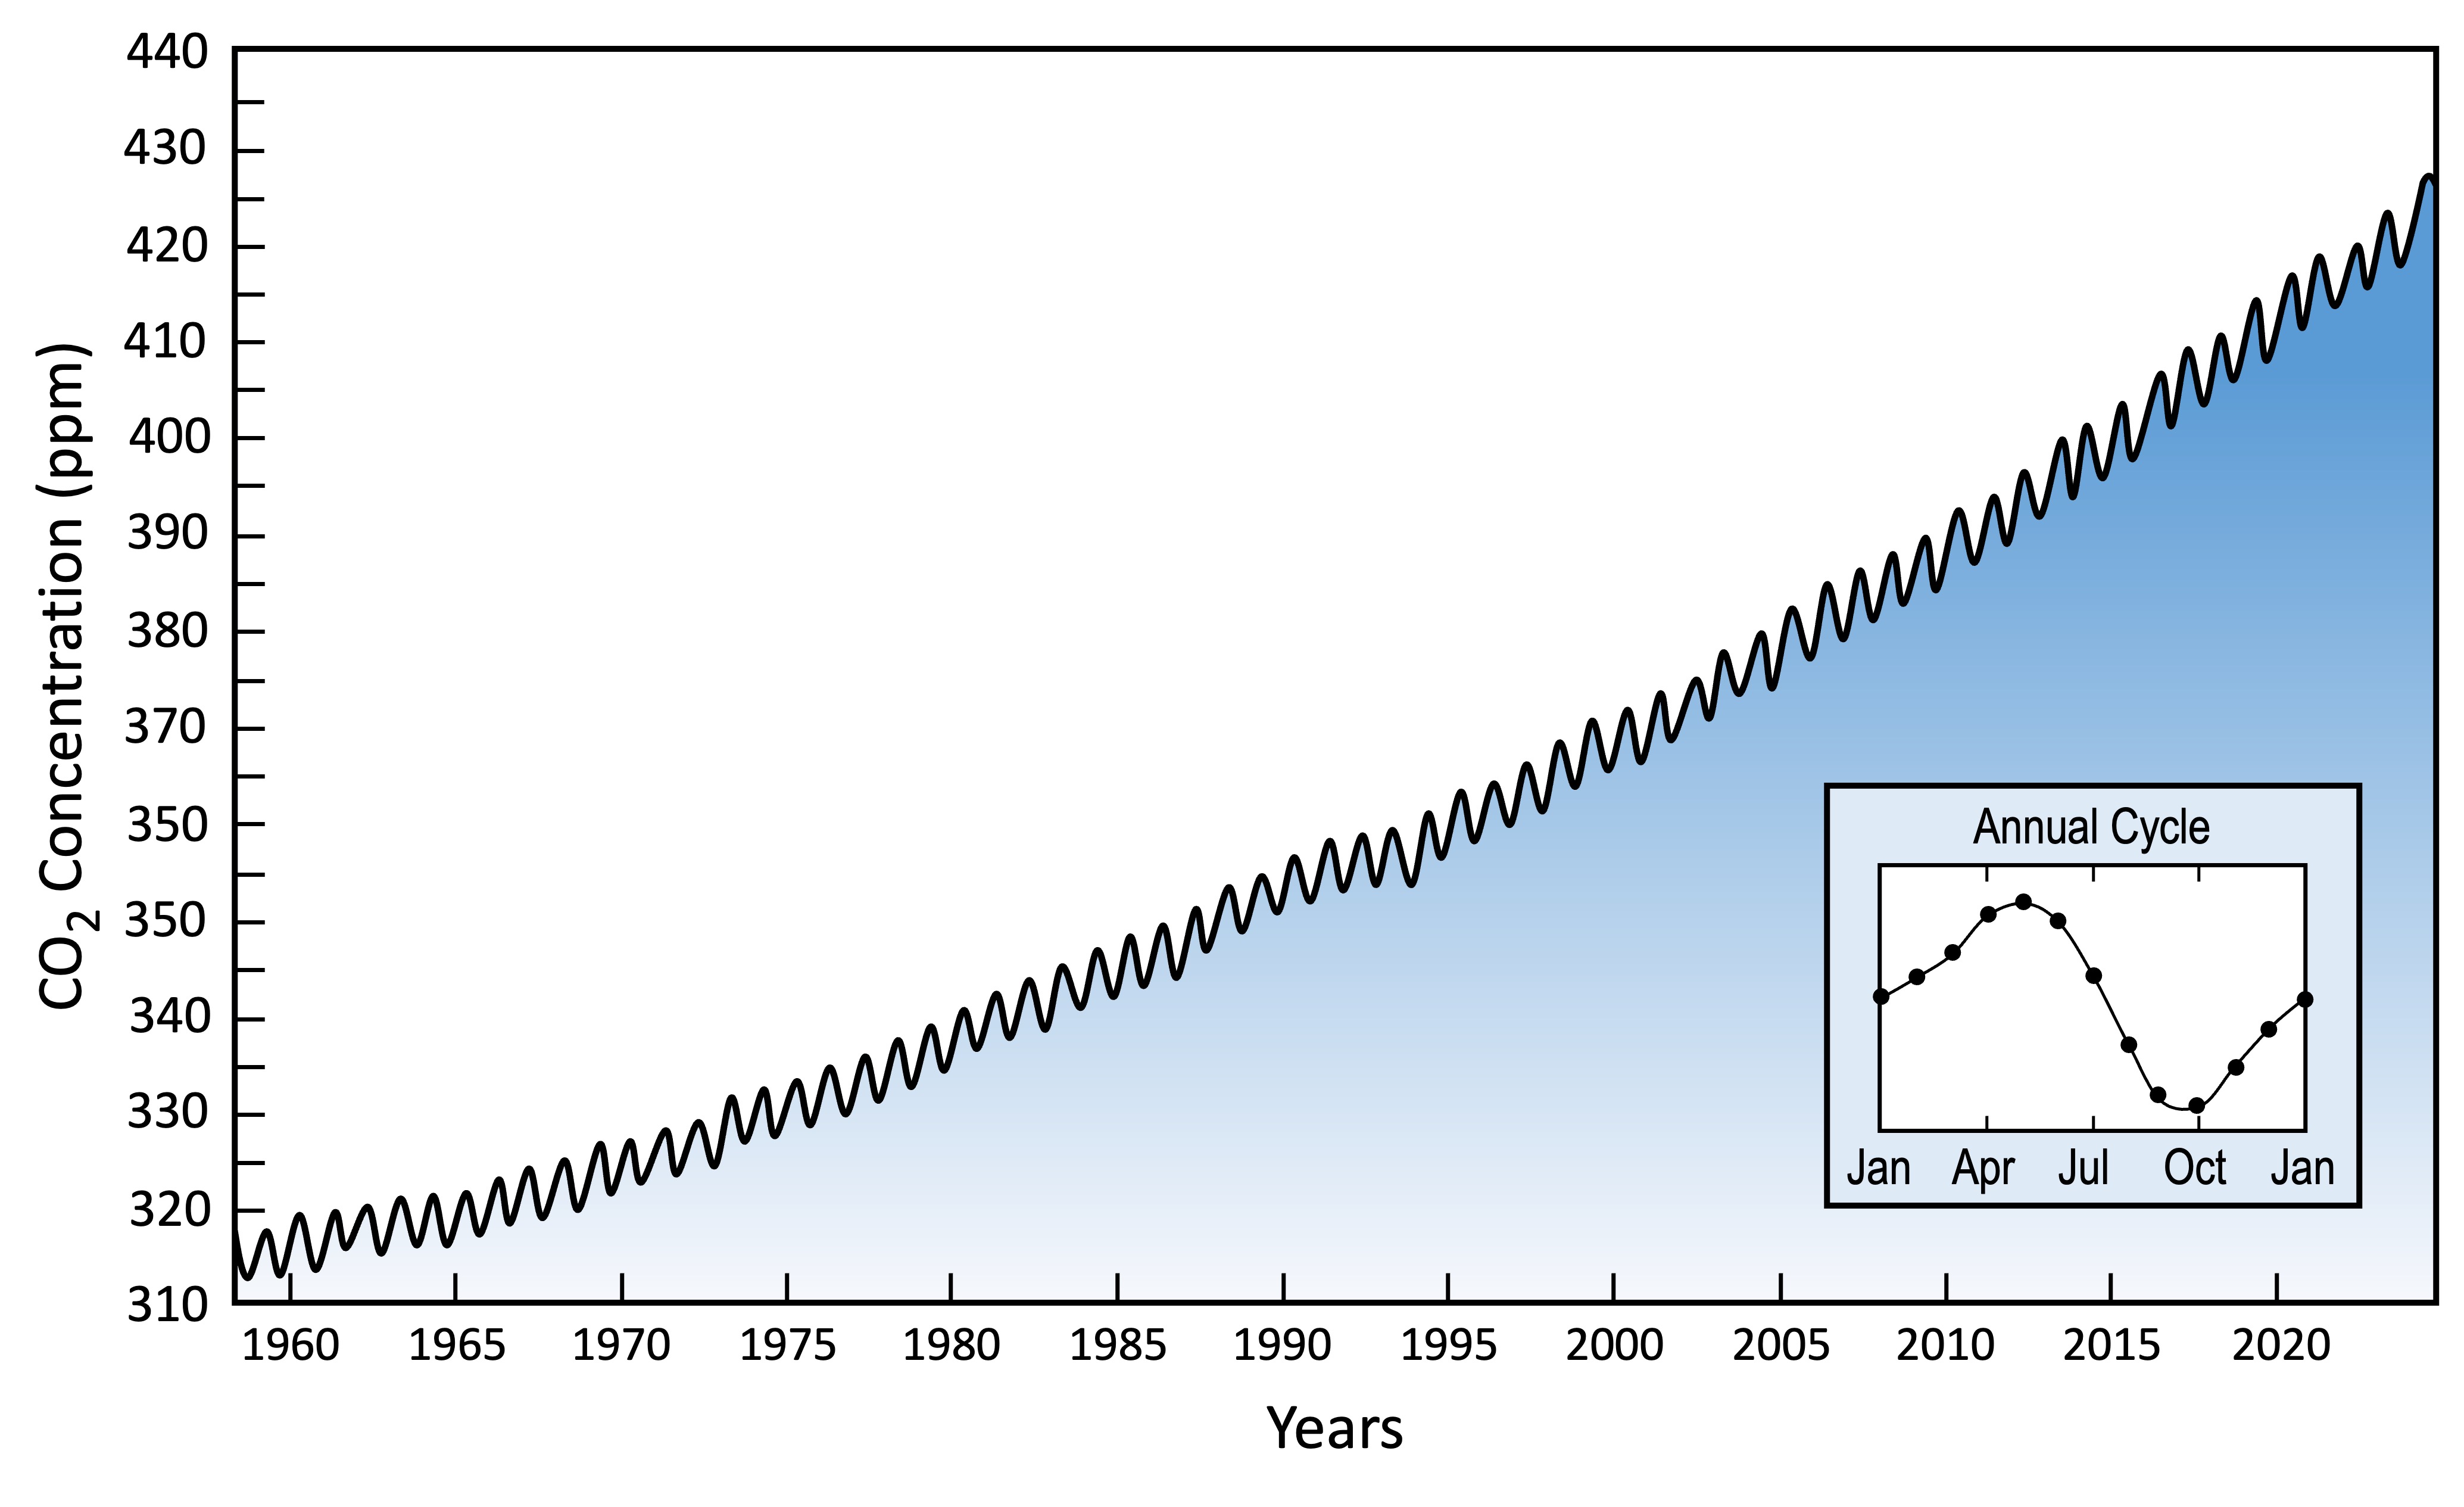
Full Record (1958 – present)
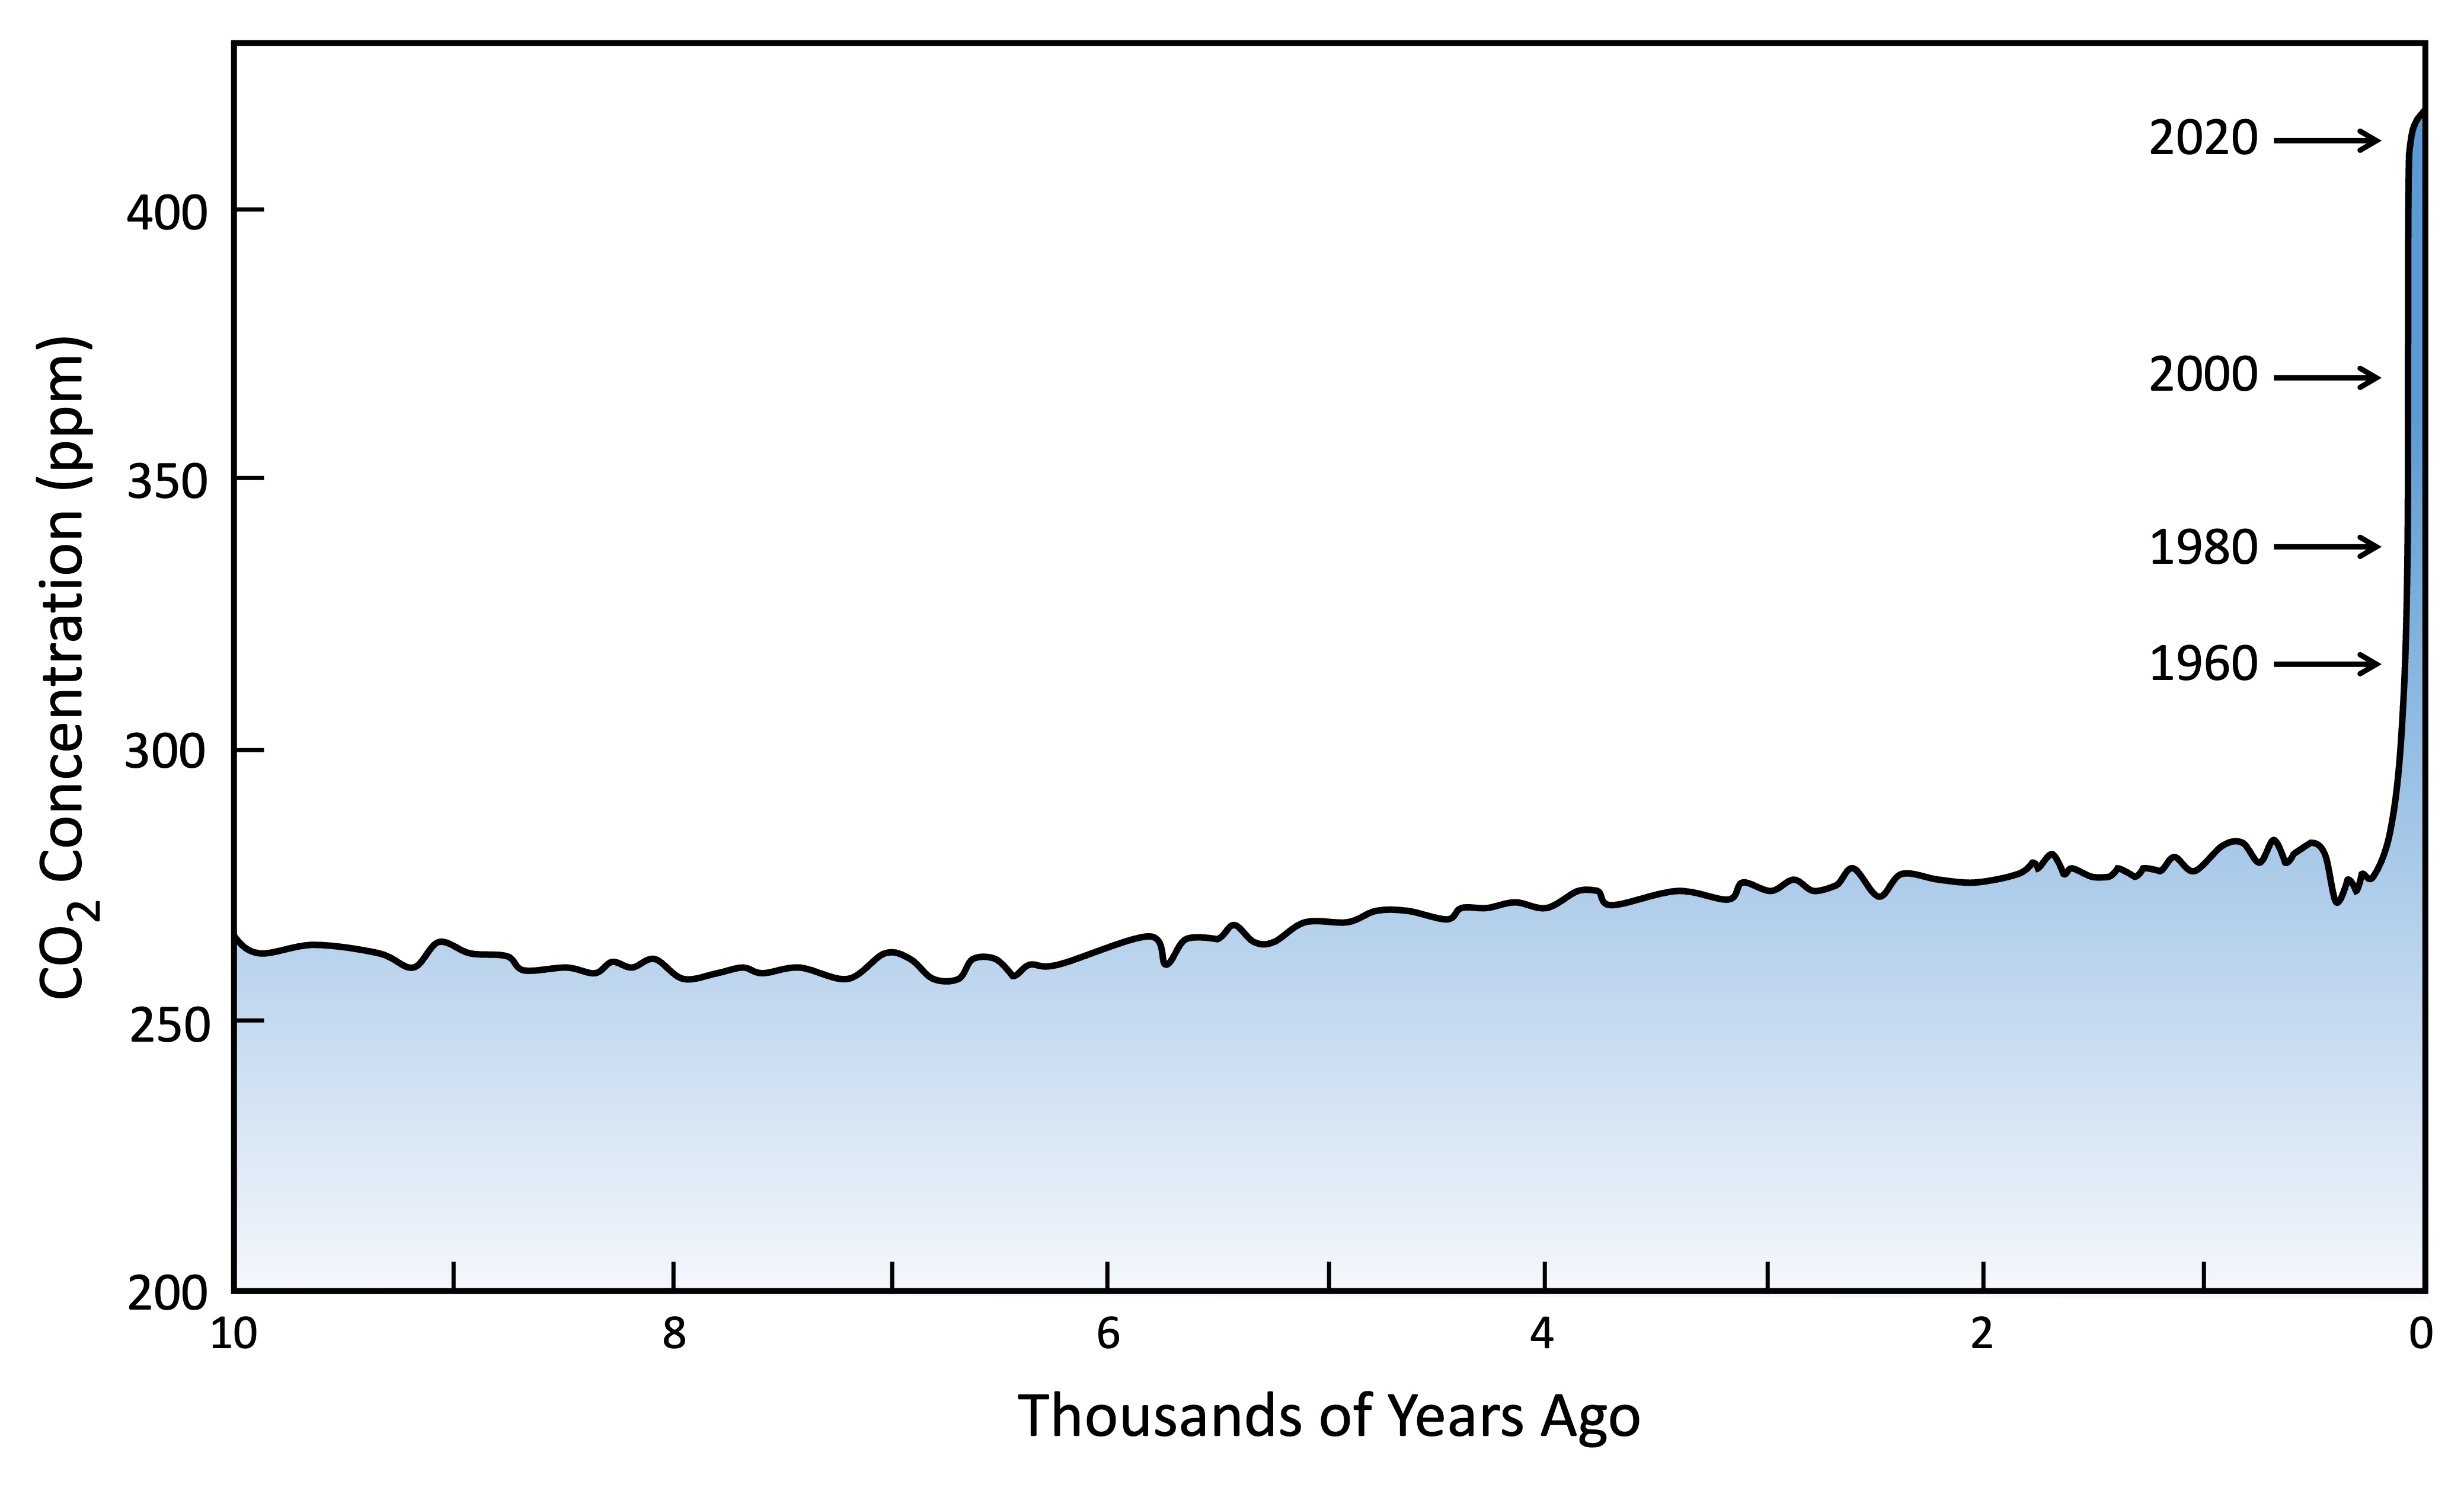
Last 10,000 years
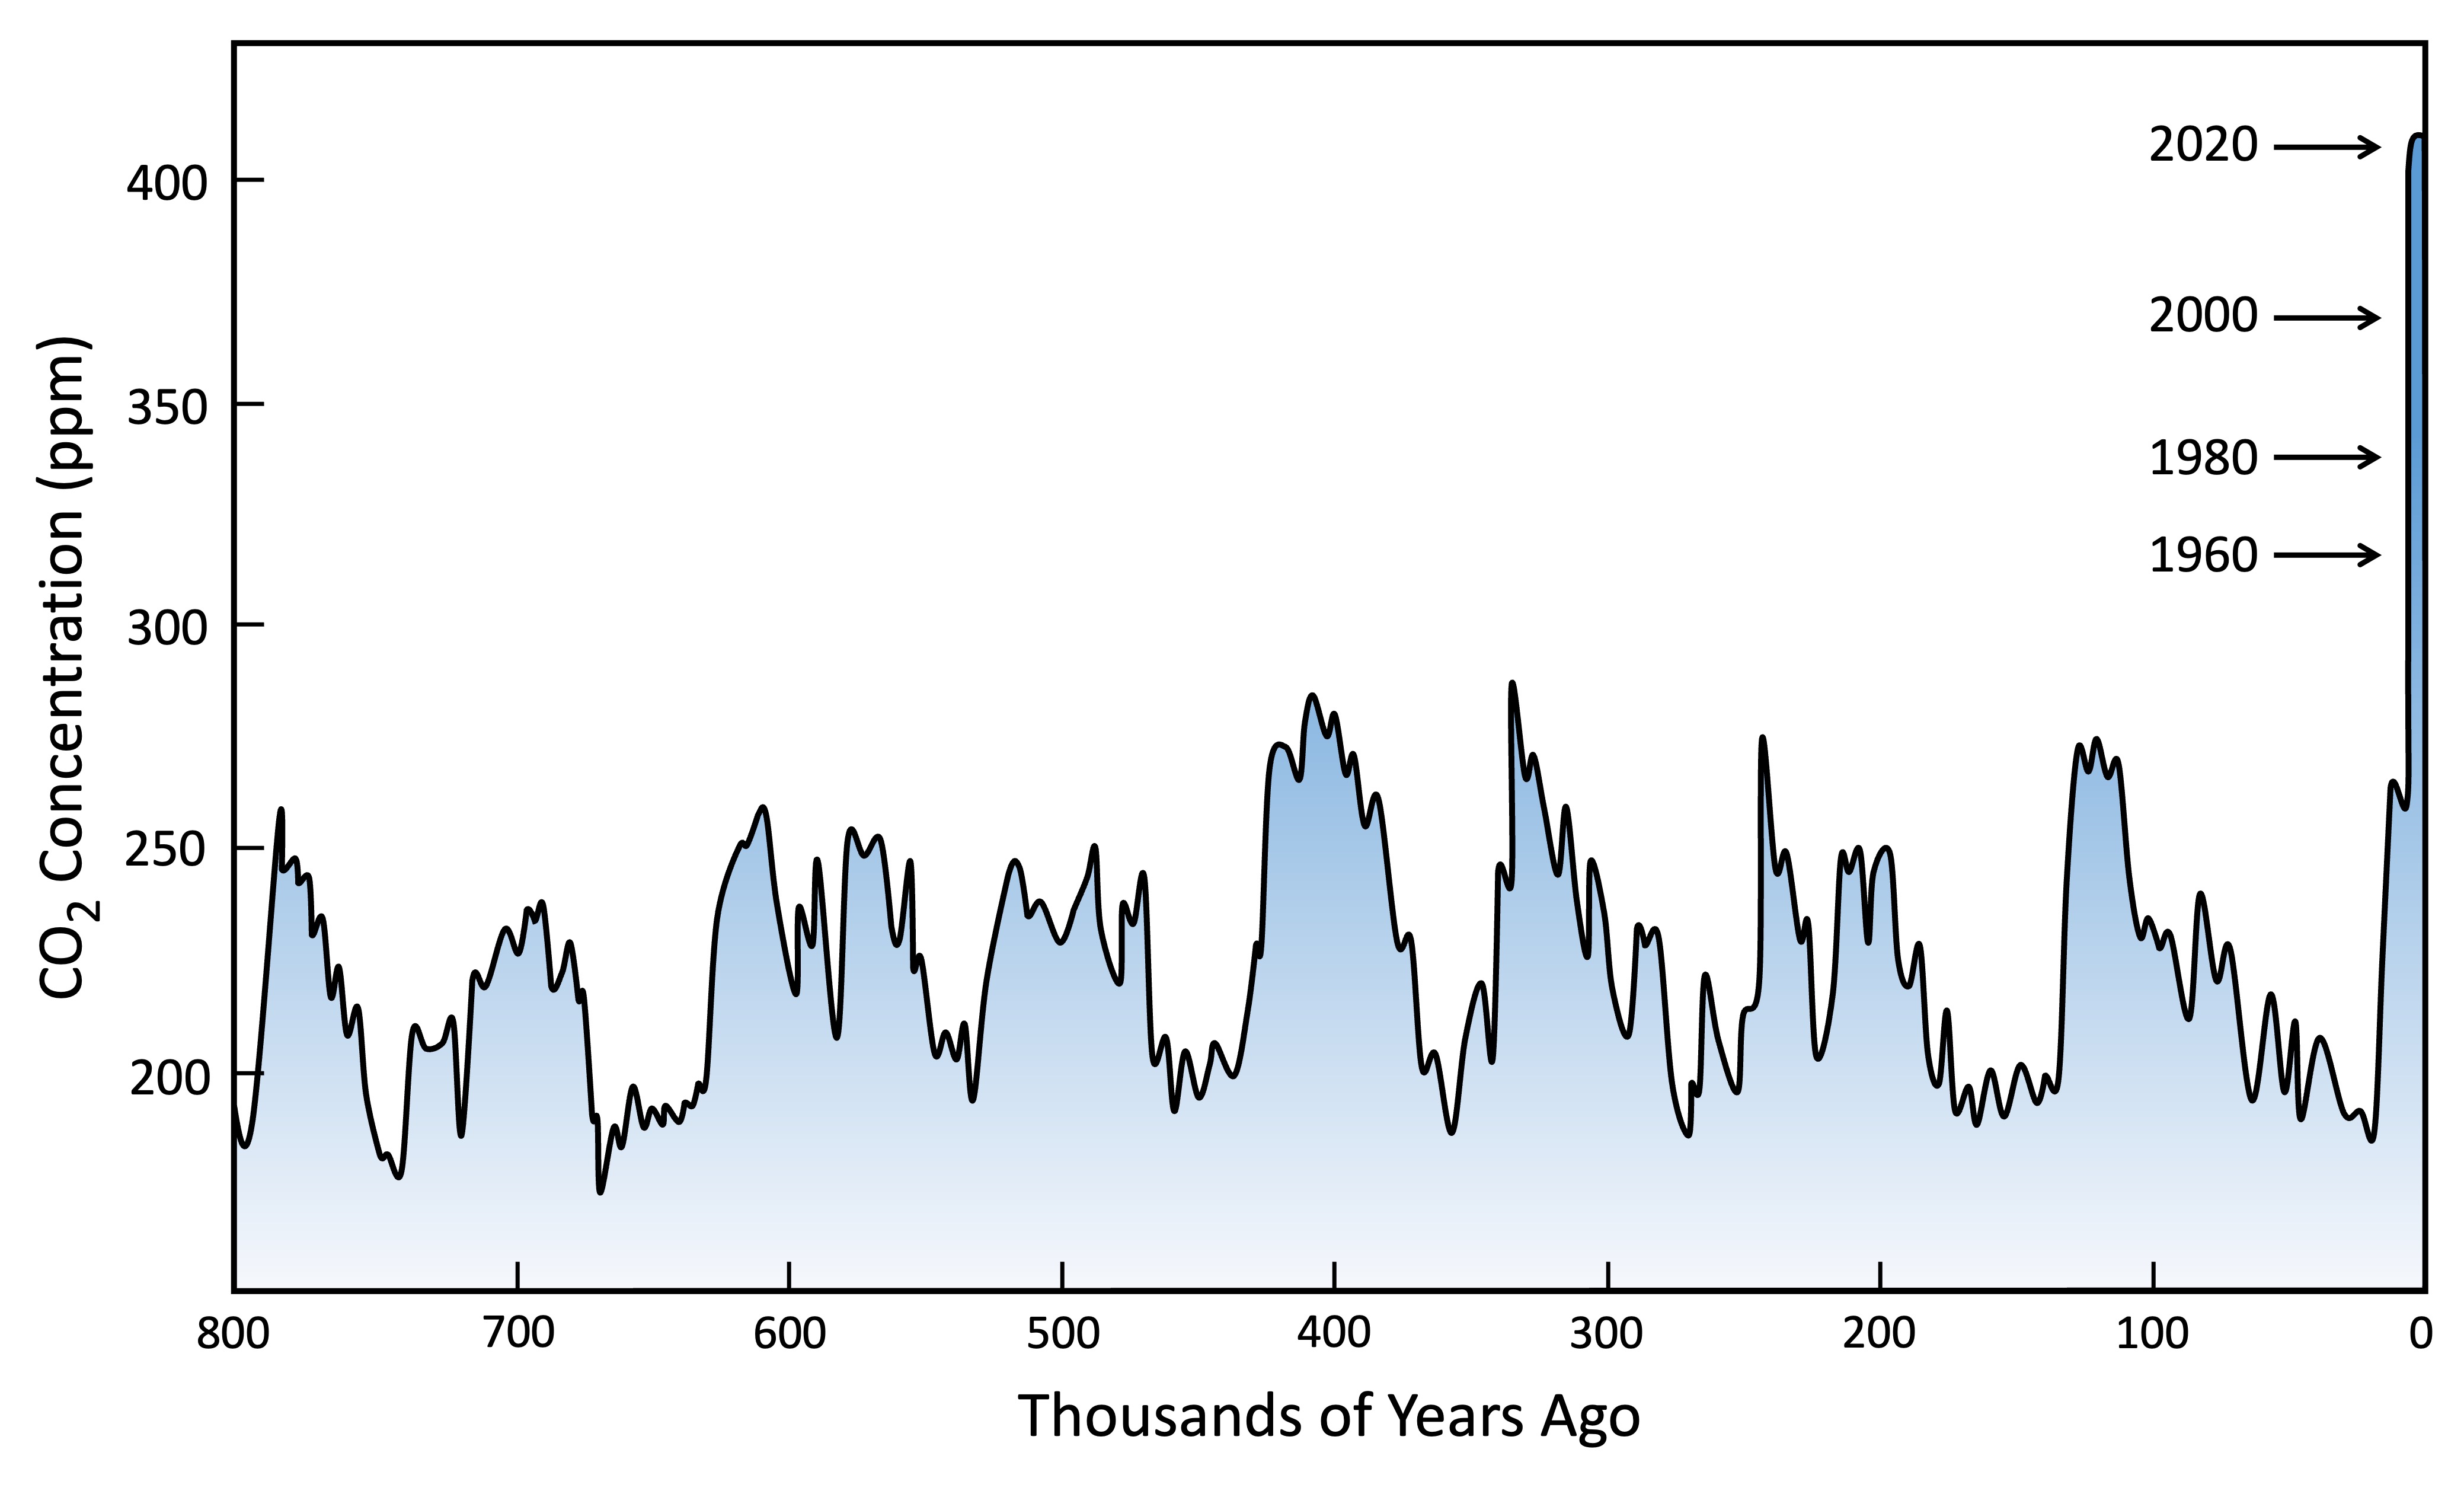
Last 800,000 years
