
Abiotic Factors
In ecology, a limiting factor is a component of an ecosystem which limits the distribution or numbers of a population
-
A limiting factor defines optimal survival conditions according to its effect on a species when in deficiency or excess
Abiotic variables are non-living environmental conditions that can function as limiting factors to influence species distribution
-
Light intensity affects the rate of photosynthesis by plants and other photosynthetic organisms
-
Temperature influences the rate of enzyme-catalysed reactions within the cells of living things
-
Soil pH and mineral content impacts the ability of a plant to grow and reproduce
-
Wind speeds and humidity can influence water loss in plants and dessication in soft-bodied animals
-
Carbon dioxide and oxygen concentrations determine the rate of photosynthesis and aerobic cell respiration
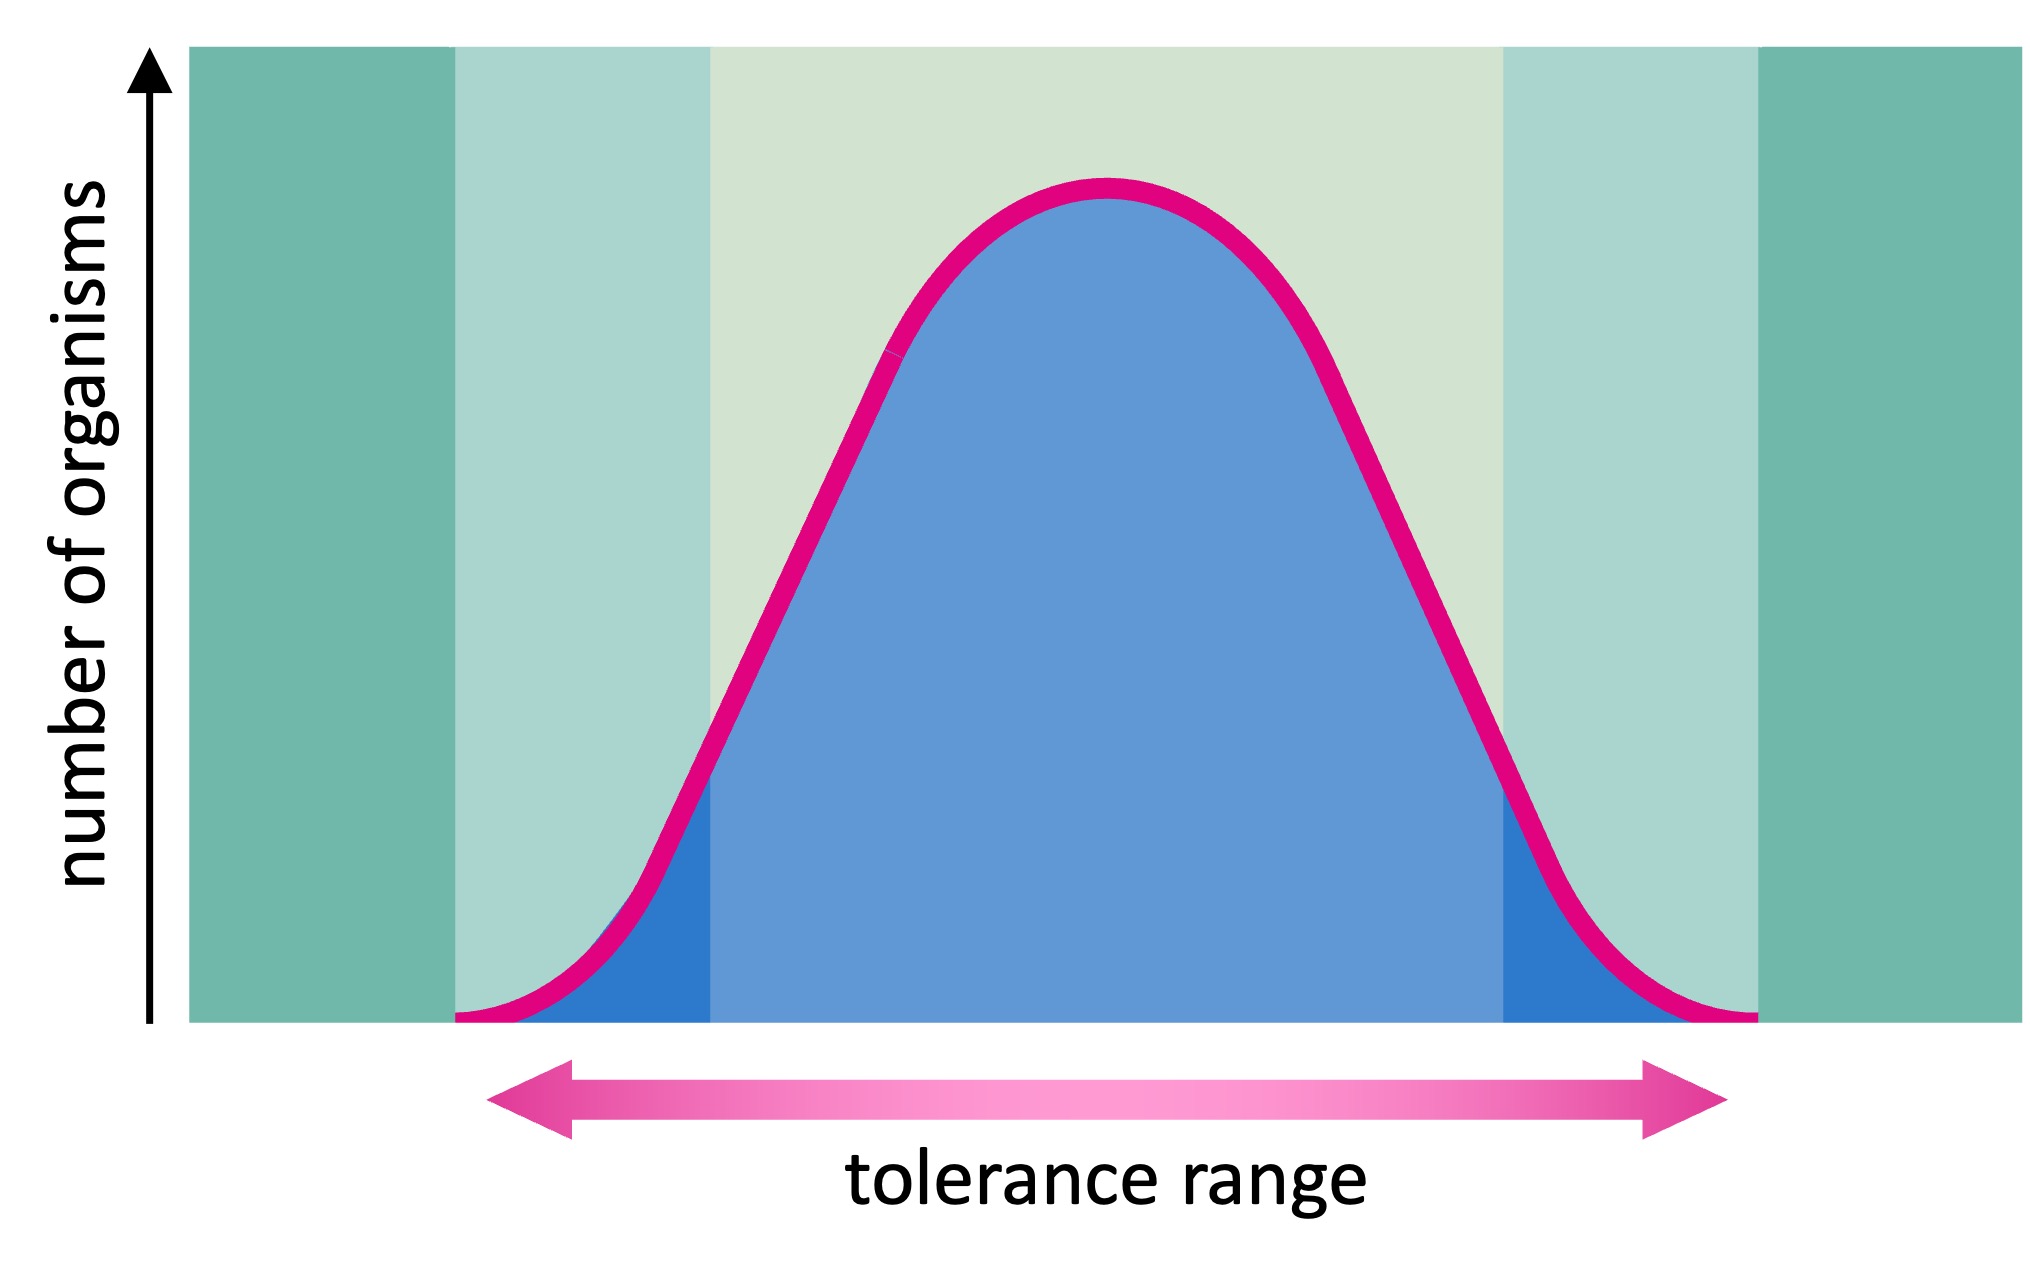
According to the law of tolerance, populations have optimal survival conditions within critical minimal and maximal thresholds
-
As a population is exposed to the extremes of a particular limiting factor, the rates of survival begin to drop
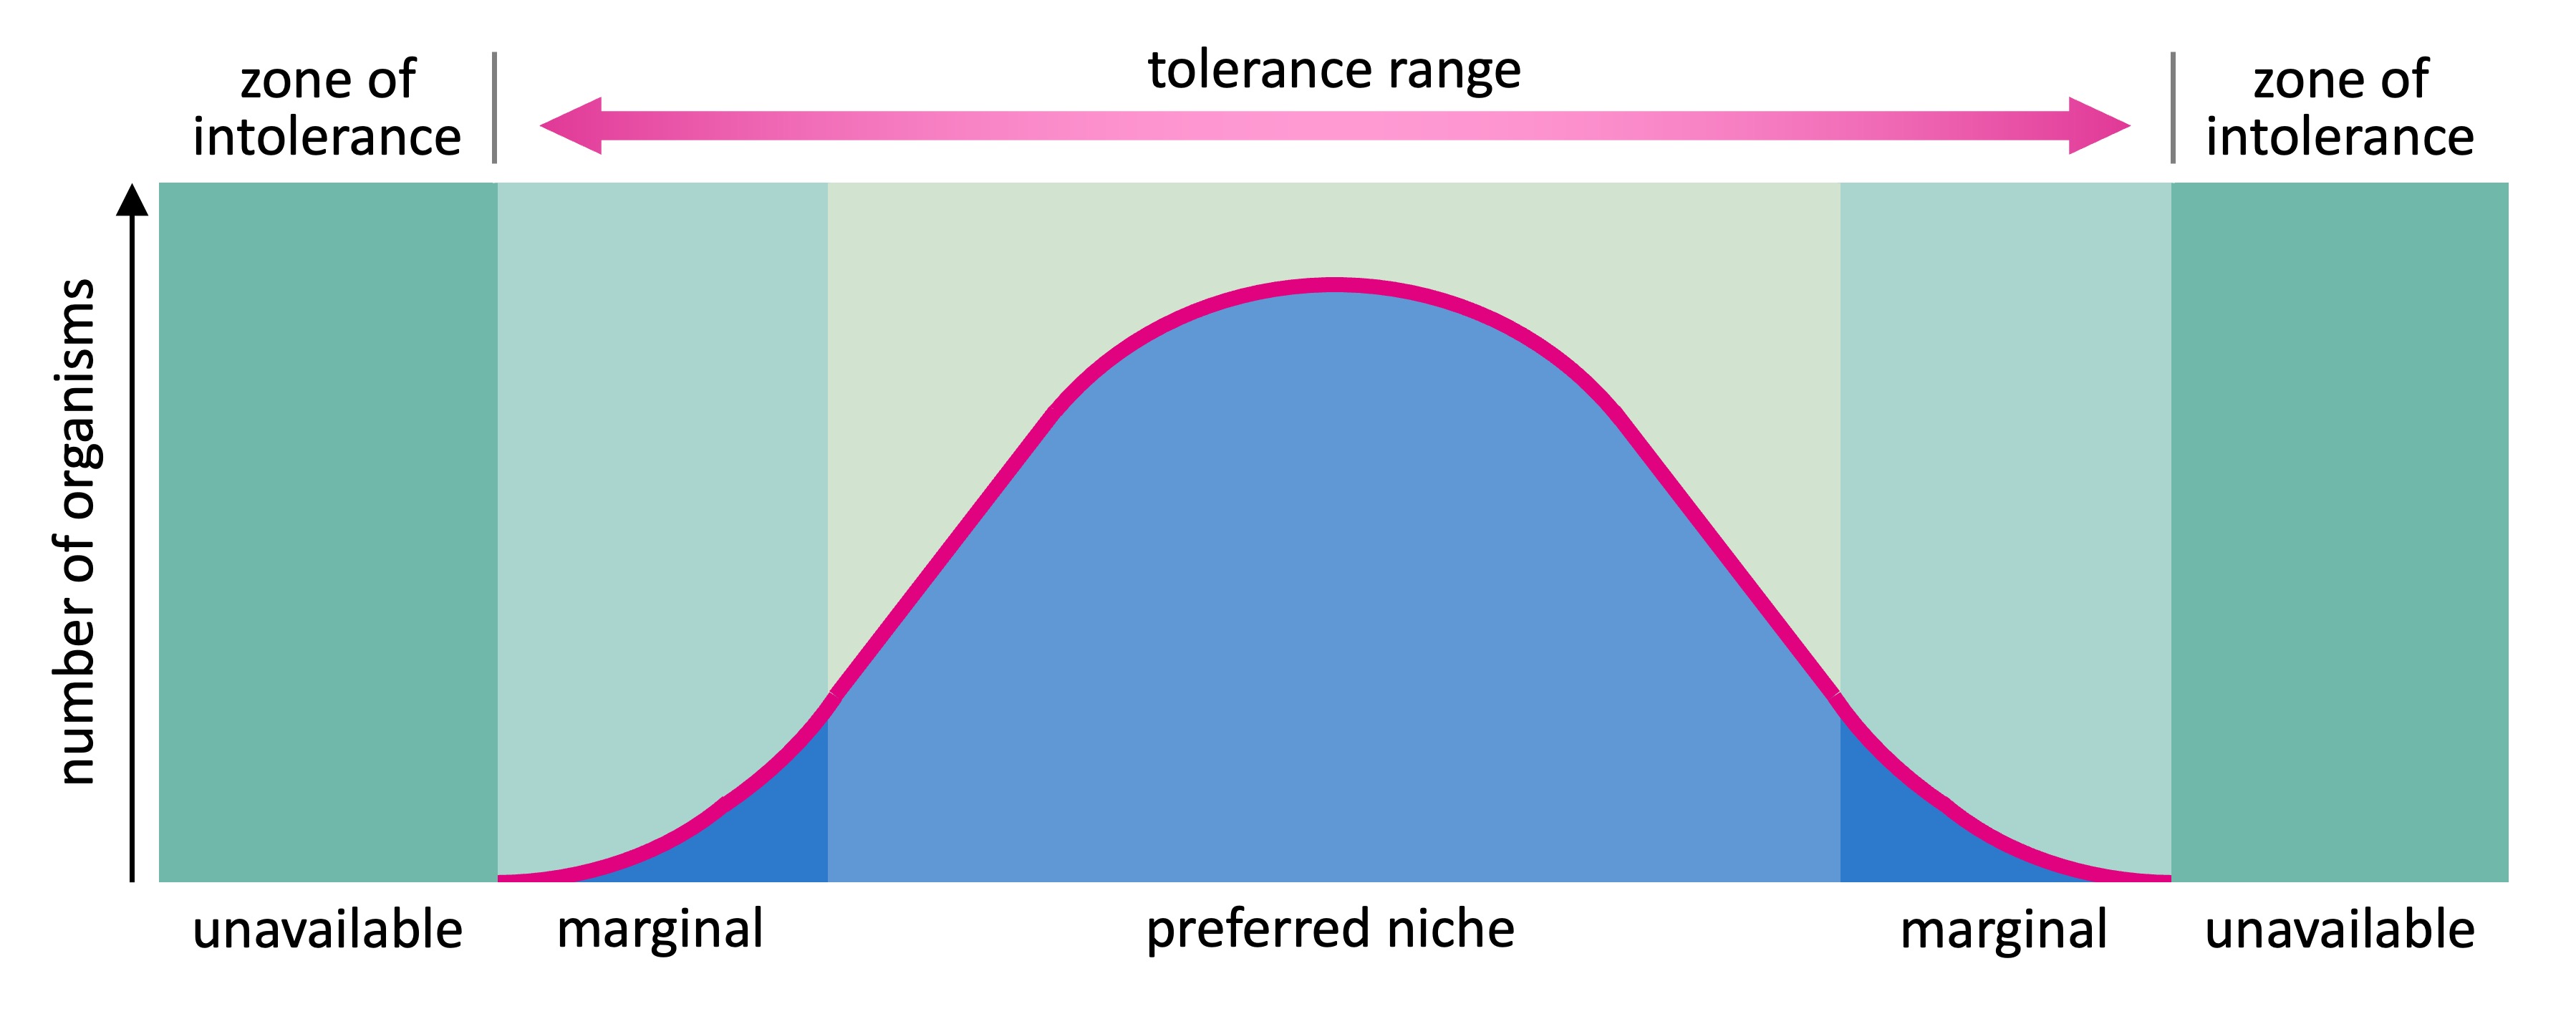
The distribution of a species in response to a limiting factor can be represented as a bell-shaped curve with 3 distinct regions:
-
Optimal zone – Central portion of curve which has conditions that favour maximal reproductive success and survivability
-
Zones of stress – Regions flanking the optimal zone, where organisms can survive but with reduced reproductive success
-
Zones of intolerance – Outermost regions in which organisms cannot survive (represents extremes of the limiting factor)
Range of Tolerance


Transects
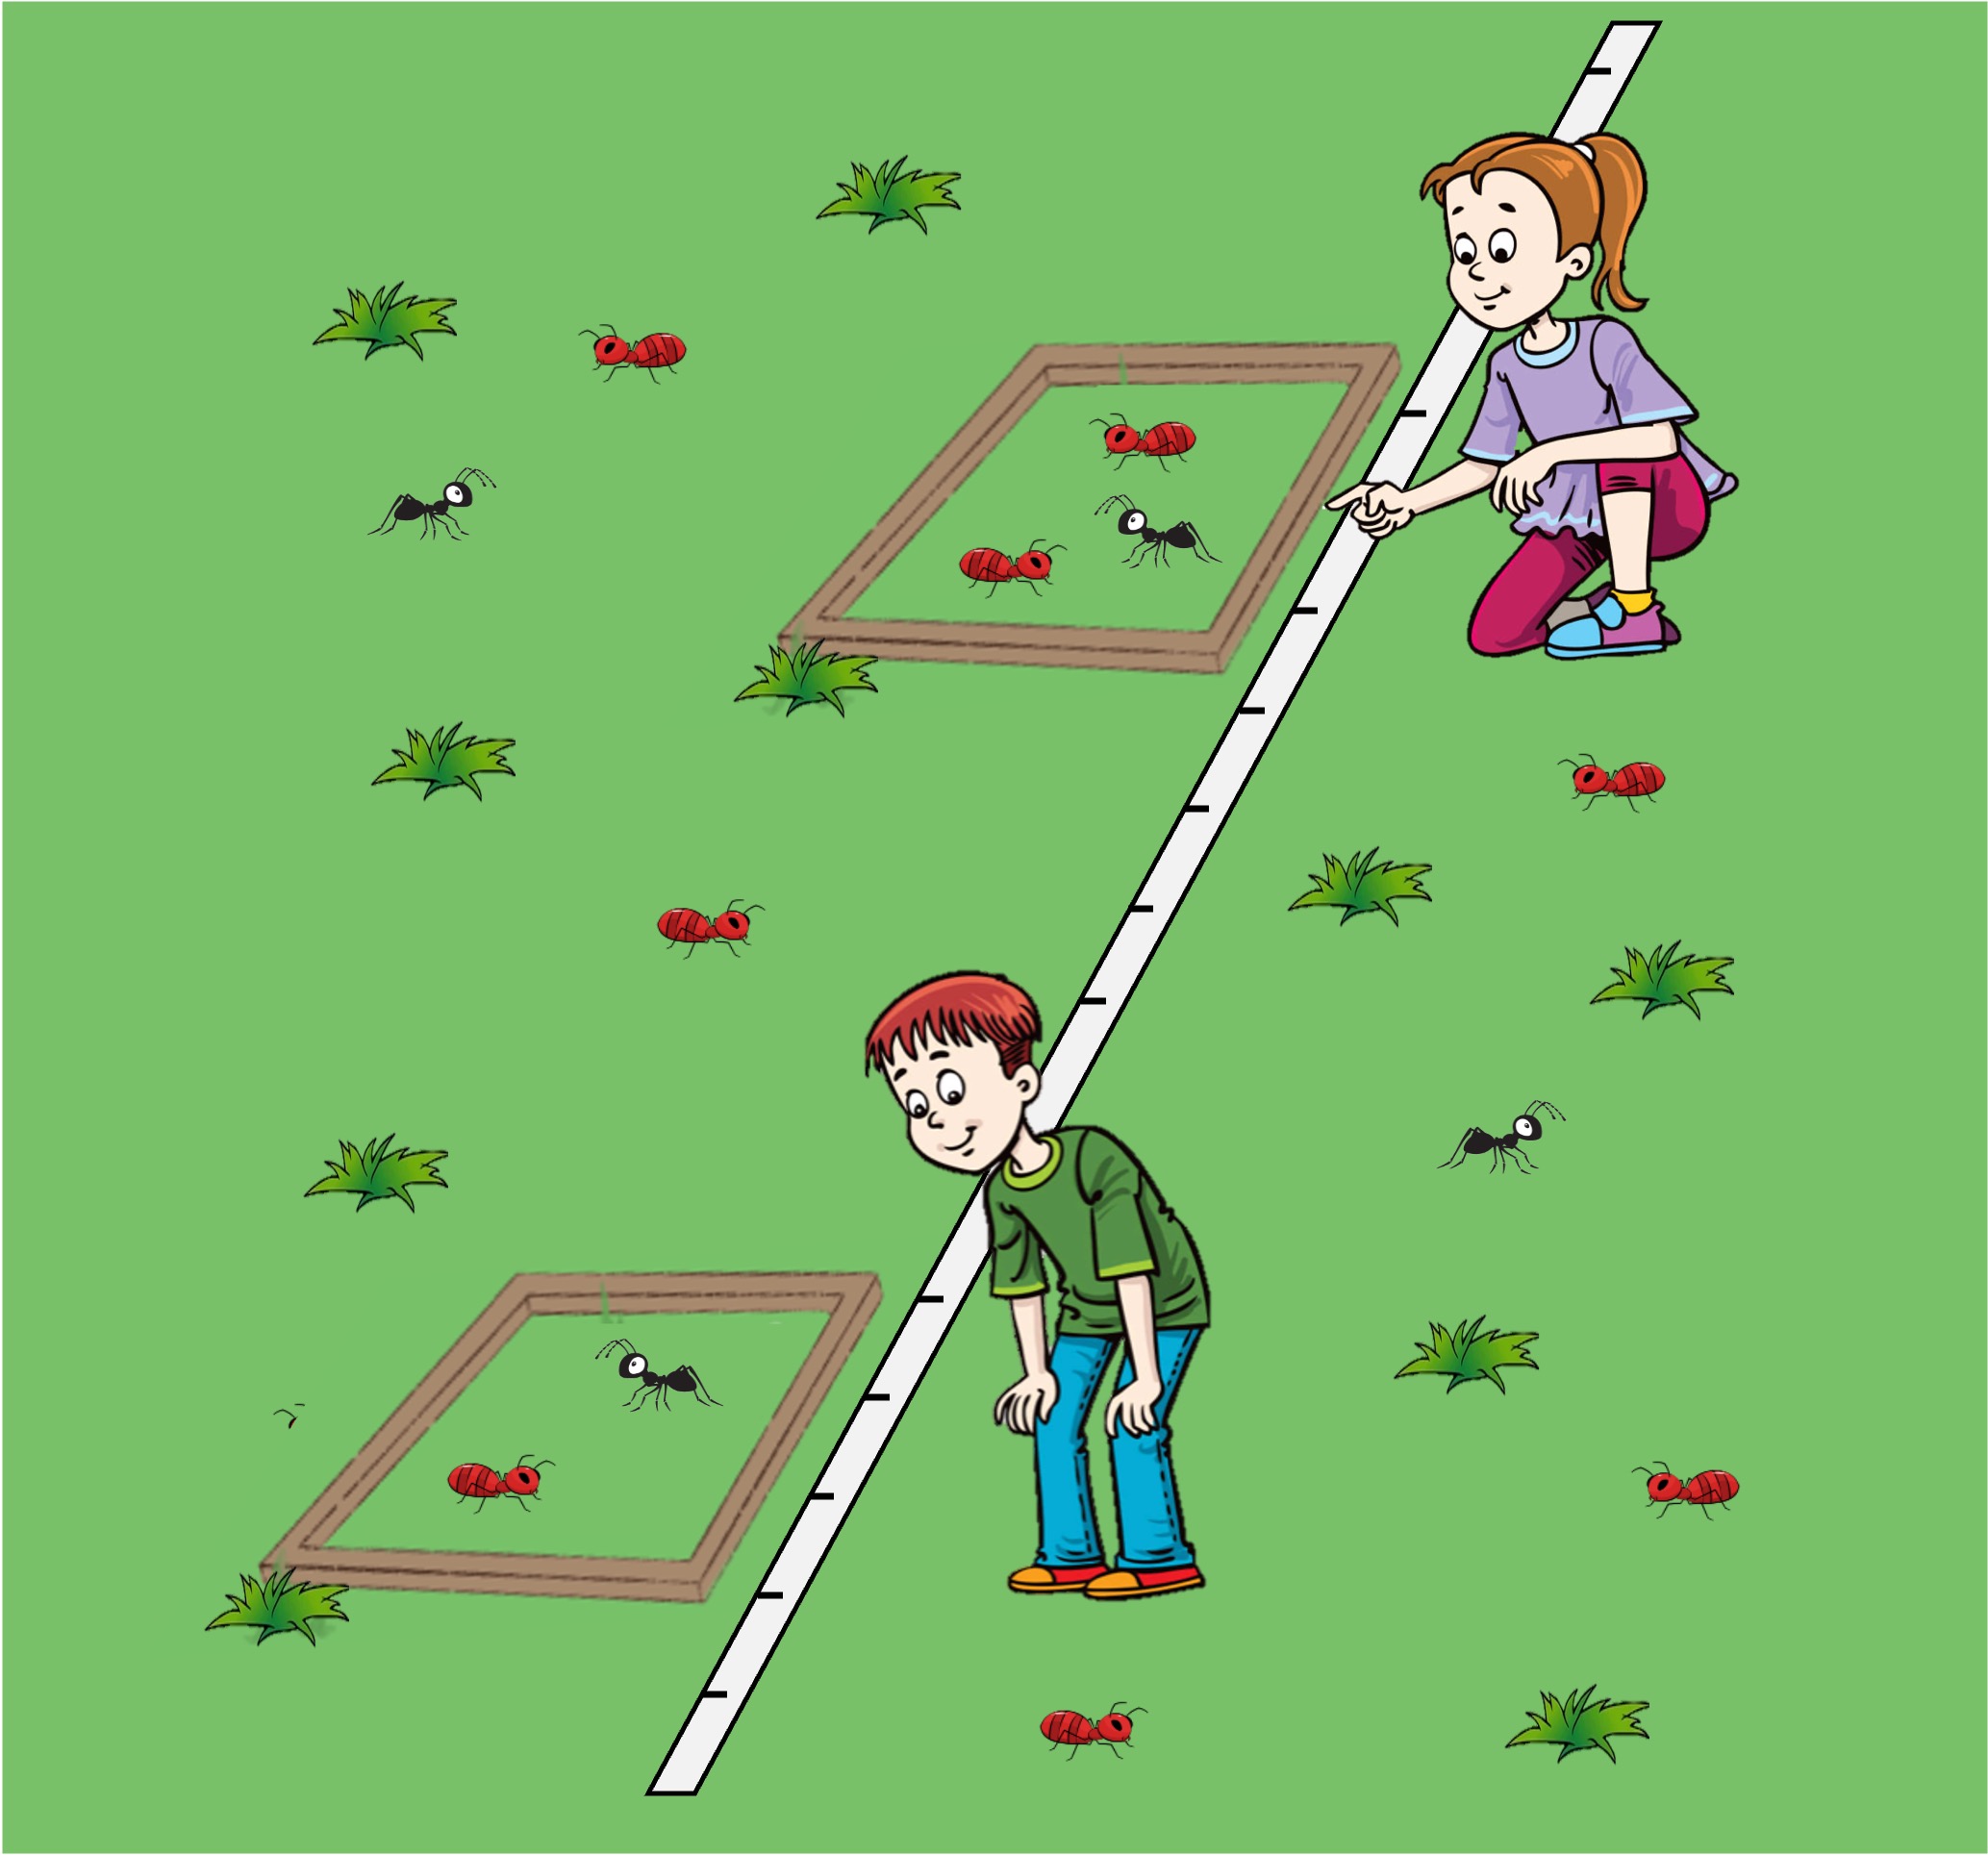
Transects may be used to assess species distribution in correlation with any abiotic factor that varies across a measurable distance
-
Transects are a straight line along an abiotic gradient from which population data can be recorded (using quadrats) to determine a pattern
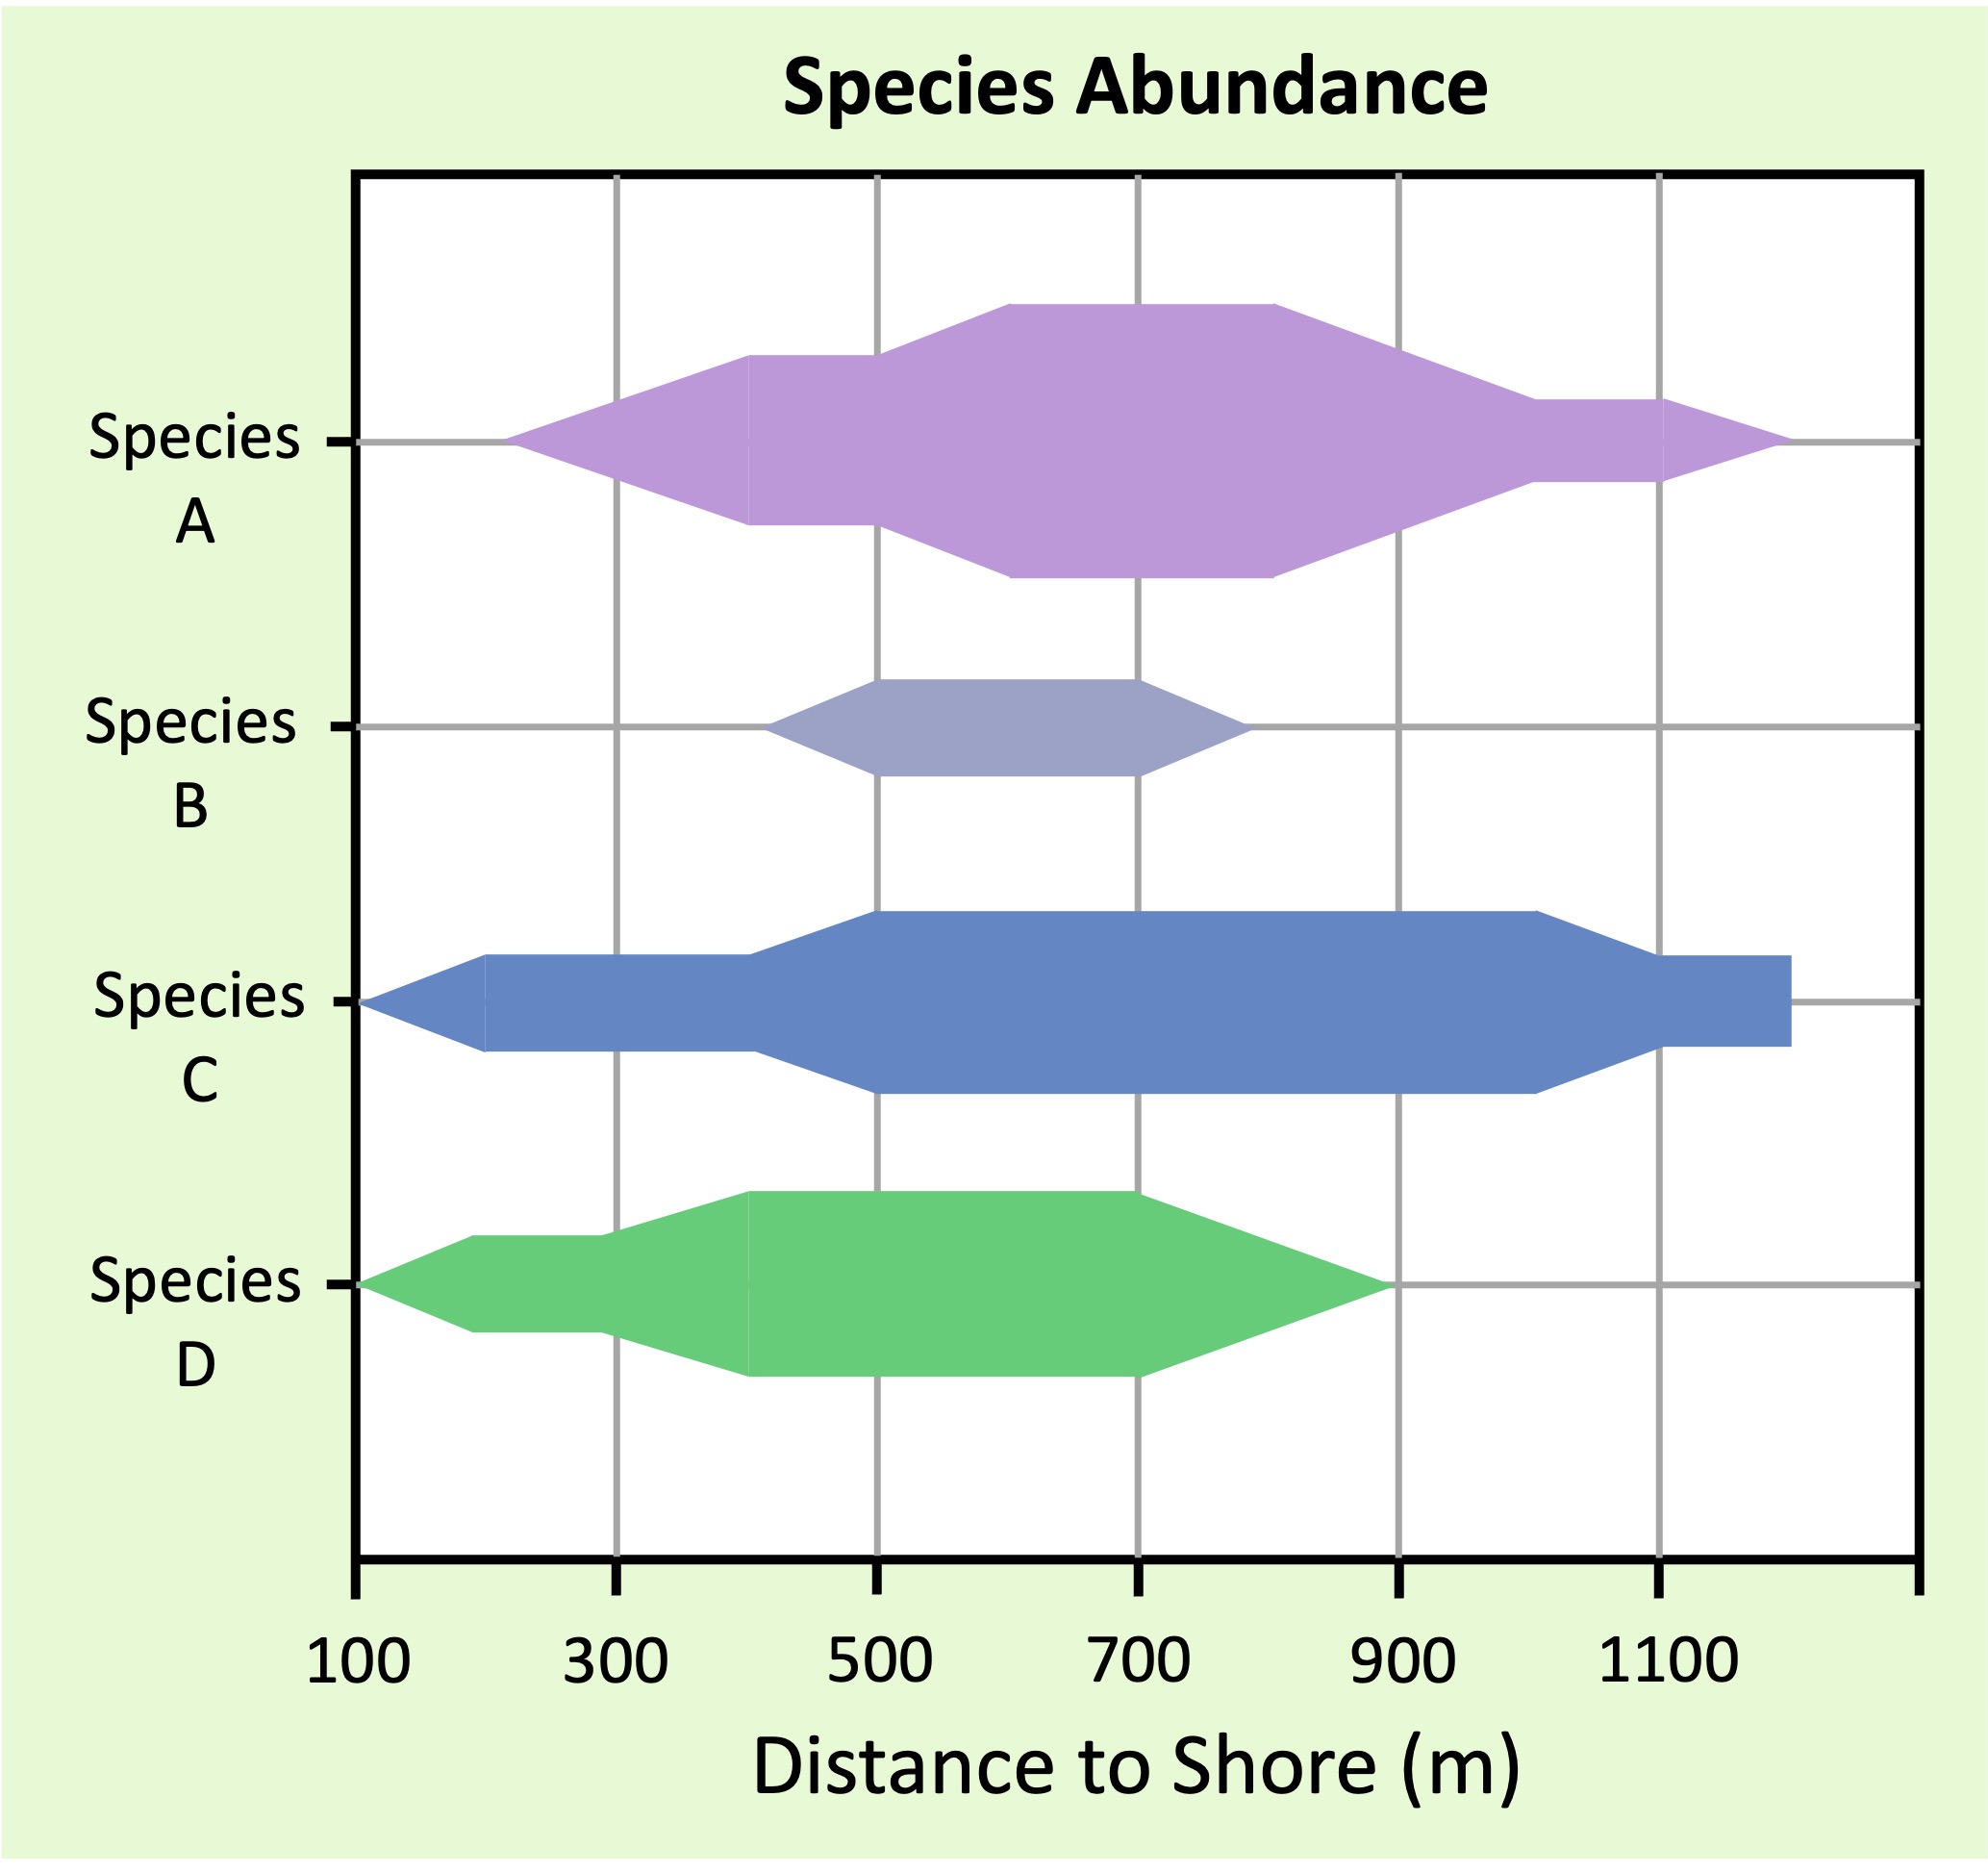
A kite graph can be used to represent changes in species distribution in a clear and effective fashion
-
The relative width of each ‘kite’ represents the abundance of an organism at a particular point along a transect
Measuring Distribution

Transect


